Main Content

plotReflectivityMap

Plots reflectivity map

Since R2024a

    Description

    plotReflectivityMap(surface) plots the reflectivity map indices relative to the size and domain of the surface, where surface is a LandSurface or SeaSurface.

    example

    plotReflectivityMap(surface,Parent=HAX) specifies the plot axes, HAX, for the reflectivity plot of the surface, where surface is a LandSurface or SeaSurface.

    HAX = plotReflectivityMap(___) returns the handle to the axes in the figure.

    Examples

    collapse all

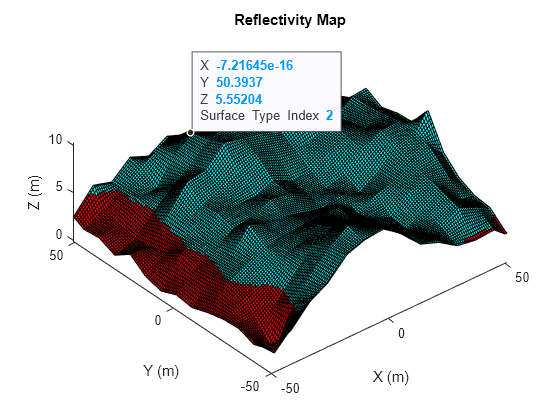
    This example shows how to plot the reflectivity map for a land surface composed of woods and rolling hills.

    Create Land Surface and Plot

    Create a land surface composed of two different materials and plot the reflectivity map.

    % Create a scenario
    scene = radarScenario;   
      
    % Specify custom reflectivity table with two surface types
    load("heightMap.mat")
    bnds        = [-50 50; -50 50];
    grazTable   = 20:0.1:60;
    freqTable   = [1e9 10e9];
    numSurfaces = 2;
    reflTypes   = zeros(numel(grazTable),numel(freqTable), ...
        numSurfaces);
    reflTypes(:,:,1) = landreflectivity("Woods", ...
        grazTable,freqTable);
    reflTypes(:,:,2) = landreflectivity("RollingHills", ...
        grazTable,freqTable);
    reflMap           = ones(size(hmap));
    reflMap(hmap > 4) = 2;
    refl = surfaceReflectivity("Custom", ...
        Frequency=freqTable, ...
        GrazingAngle=grazTable,Reflectivity=reflTypes);
        
    % Create land surface
    srf = landSurface(scene,Terrain=hmap,Boundary=bnds, ...
        RadarReflectivity=refl,ReflectivityMap=reflMap);
        
    % Plot reflectivity map
    plotReflectivityMap(srf)

    Figure contains an axes object. The axes object with title Reflectivity Map, xlabel X (m), ylabel Y (m) contains 2 objects of type surface, line. One or more of the lines displays its values using only markers

    Input Arguments

    collapse all

    Surface, specified as a LandSurface object created by landSurface or SeaSurface object created by seaSurface.

    Handle to plot axes, specified as an Axes object. Use the gca function to get and set properties of the current axes.

    Output Arguments

    collapse all

    Handle to the axes displayed in the figure, returned as an Axes object.

    Version History

    Introduced in R2024a