clusterDBSCAN.plot
Plot clusters
Description
Examples
Create detections of extended objects with measurements in range and Doppler. Assume the maximum unambiguous range is 20 m and the unambiguous Doppler span extends from Hz to Hz. Data for this example is contained in the dataClusterDBSCAN.mat file. The first column of the data matrix represents range, and the second column represents Doppler.
The input data contains the following extended targets and false alarms:
an unambiguous target located at
an ambiguous target in Doppler located at
an ambiguous target in range located at
an ambiguous target in range and Doppler located at
5 false alarms
Create a clusterDBSCAN object and specify that disambiguation is not performed by setting EnableDisambiguation to false. Solve for the cluster indices.
load('dataClusterDBSCAN.mat');
cluster1 = clusterDBSCAN('MinNumPoints',3,'Epsilon',2, ...
    'EnableDisambiguation',false);
idx = cluster1(x);
Use the clusterDBSCAN plot object function to display the clusters.
plot(cluster1,x,idx)
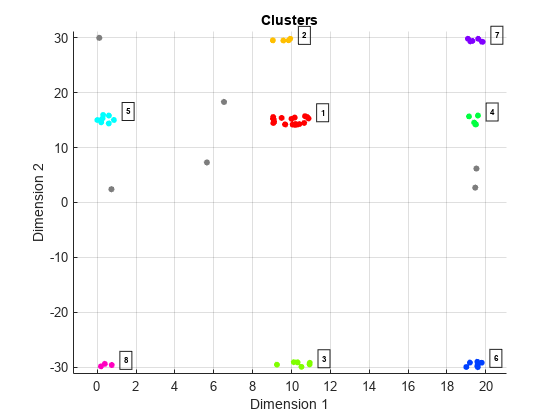
The plot indicates that there are eight apparent clusters and six noise points. The 'Dimension 1' label corresponds to range and the 'Dimension 2' label corresponds to Doppler.
Next, create another clusterDBSCAN object and set EnableDisambiguation to true to specify that clustering is performed across the range and Doppler ambiguity boundaries.
cluster2 = clusterDBSCAN('MinNumPoints',3,'Epsilon',2, ...
    'EnableDisambiguation',true,'AmbiguousDimension',[1 2]);
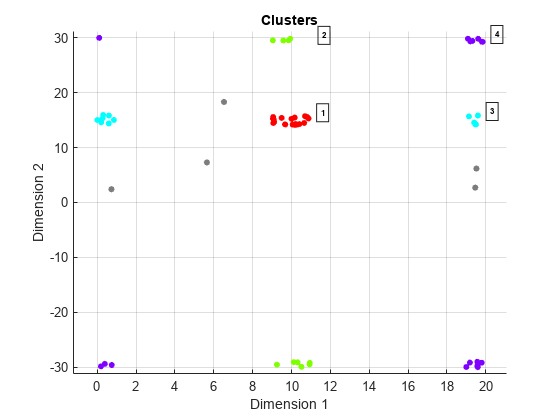
Perform the clustering using ambiguity limits and then plot the clustering results. The DBSCAN clustering results correctly show four clusters and five noise points. For example, the points at ranges close to zero are clustered with points near 20 m because the maximum unambiguous range is 20 m.
amblims = [0 maxRange; minDoppler maxDoppler];
idx = cluster2(x,amblims);
plot(cluster2,x,idx)
Input Arguments
Output Arguments
Version History
Introduced in R2021a