plotResponse
System object: phased.CustomAntennaElement
Namespace: phased
Plot response pattern of antenna
Syntax
plotResponse(H,FREQ)

plotResponse(H,FREQ,Name,Value)

hPlot = plotResponse(___)
Description
plotResponse( plots
the element response pattern along the azimuth cut, where the elevation
angle is 0. The operating frequency is specified in H,FREQ)FREQ.
plotResponse(
plots the element response with additional options specified by one
or more H,FREQ,Name,Value)Name,Value pair arguments.
hPlot = plotResponse(___)
Input Arguments
| |
|
Name-Value Arguments
Examples
Create a custom antenna with a cosine pattern. Then, plot the antenna's response.
Create the antenna and calculate the response. The user-defined pattern is omnidirectional in the azimuth direction and has a cosine pattern in the elevation direction. Assume the antenna works at 1 GHz.
fc = 1e9;
azang = [-180:180];
elang = [-90:90];
magpattern = mag2db(repmat(cosd(elang)',1,numel(azang)));
phasepattern = zeros(size(magpattern));
antenna = phased.CustomAntennaElement('AzimuthAngles',azang, ...
    'ElevationAngles',elang,'MagnitudePattern',magpattern, ...
    'PhasePattern',phasepattern);
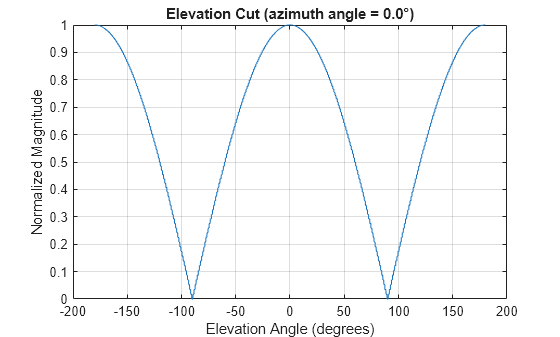
Plot an elevation cut of the magnitude response as a line plot.
plotResponse(antenna,fc,'RespCut','El','ElevationAngles',[-90:0.1:90],...
    'Format','Line','Unit','mag')
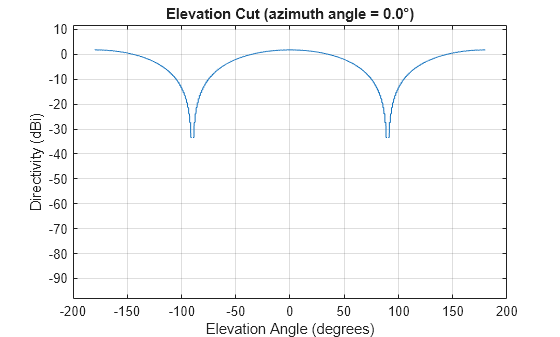
Plot an elevation cut of the directivity as a line plot, showing that the maximum directivity is approximately 2 dB.
plotResponse(antenna,fc,'RespCut','El','ElevationAngles',[-90:0.1:90],...
    'Format','Line','Unit','dbi')
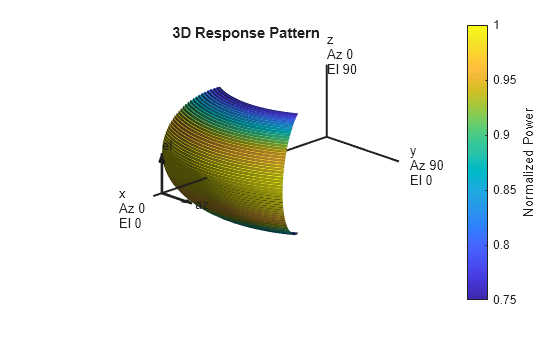
Create an antenna with a custom response. The user-defined pattern is omnidirectional in the azimuth direction and has a cosine pattern in the elevation direction. Assume the antenna operates at a frequency of 1 GHz. Display the 3-D response for a 60 degree range of azimuth and elevation angles centered at 0 degrees azimuth and 0 degrees elevation in 0.1 degree increments.
fc = 1e9;
azang = [-180:180];
elang = [-90:90];
magpattern = mag2db(repmat(cosd(elang)',1,numel(azang)));
phasepattern = zeros(size(magpattern));
antenna = phased.CustomAntennaElement('AzimuthAngles',azang, ...
    'ElevationAngles',elang,'MagnitudePattern',magpattern, ...
    'PhasePattern',phasepattern);
resp = antenna(fc,[0;0]);
plotResponse(antenna,fc,'RespCut','3D','AzimuthAngles',[-30:0.1:30],...
    'ElevationAngles',[-30:0.1:30],'Format','Polar','Unit','pow')