pdegplot
Plot PDE geometry
Description
pdegplot(
plots with additional options specified by one or more name-value arguments. For
example, you can specify whether to display vertex, edge, face, and cell
labels.g,Name,Value)
In R2026a: pdegplot( plots the
geometry in target axes, using any of the previous syntaxes.ax,___)
h = pdegplot(___)
Examples
Plot the geometry of a region defined by a few simple shapes.
g = [2	 1      1     1      1     1      1     1     1     4     4;
    -1	-0.6   -0.5  -0.4   -0.5   0.4	  0.5	0.6   0.5  -1	  0.17;
     1	-0.5   -0.4  -0.5   -0.6   0.5    0.6   0.5   0.4   0.17  1;
     0	-0.25  -0.35 -0.25  -0.15 -0.25  -0.35 -0.25 -0.15  0    -0.74;
     0	-0.35  -0.25 -0.15  -0.25 -0.35	 -0.25 -0.15 -0.25 -0.74  0;
     0	 0      0     0      0     0      0     0     0     1     1;
     1	 1      1     1      1     1      1     1     1     0     0;
     0  -0.5   -0.5  -0.5   -0.5   0.5    0.5   0.5   0.5   0     0;
     0  -0.25  -0.25 -0.25  -0.25 -0.25  -0.25 -0.25 -0.25  0     0;
     0	 0.1    0.1   0.1    0.1   0.1    0.1   0.1   0.1   1     1;
     0	 0      0     0      0     0      0     0     0     0.75  0.75;
     0	 0      0     0      0     0      0     0     0     0     0];
 pdegplot(g)
View the vertex labels, edge labels, and the face label. Add space at the top of the plot to see the top edge clearly.
pdegplot(g,VertexLabels="on", ...
           EdgeLabels="on", ...
           FaceLabels="on")
ylim([-.8,.1])

Import a 3-D geometry file. Plot the geometry and turn on face labels. To see the labels on all faces of the geometry, set the transparency to 0.5.
gm = fegeometry("BracketWithHole.stl");
pdegplot(gm,FaceLabels="on",FaceAlpha=0.5)

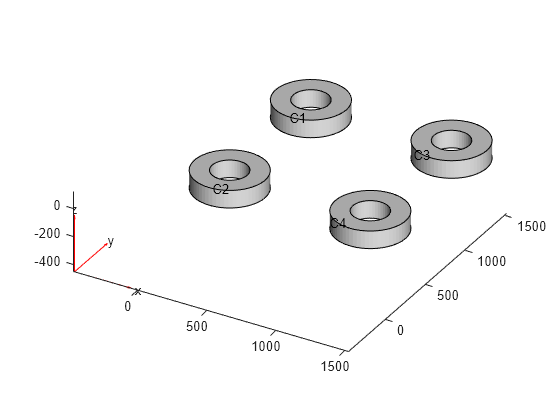
Import a 3-D geometry file. Plot the geometry and turn on cell labels.
gm = fegeometry("DampingMounts.stl");
pdegplot(gm,CellLabels="on")
Since R2023b
Create and plot a 3-D geometry consisting of three nested cuboids of the same height. By default, pdegplot uses lighting effects to display geometric features, like different cells, with more contrast.
gm = multicuboid([2 3 5],[4 6 10],3);
pdegplot(gm,CellLabels="on",FaceAlpha=0.3)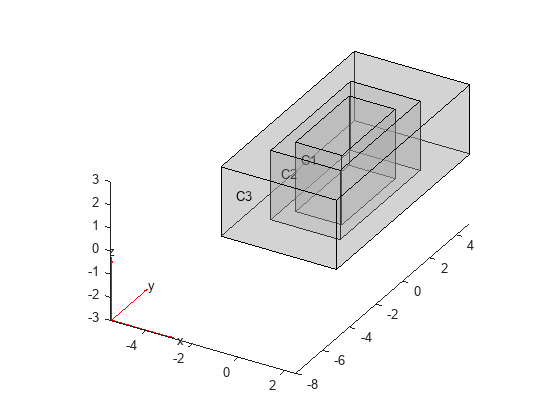
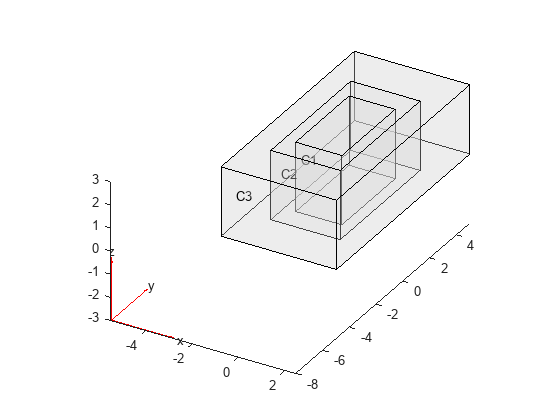
To obtain the same plot appearance as in R2023a or earlier, turn off the lighting effects.
figure
pdegplot(gm,CellLabels="on",FaceAlpha=0.3,Lighting="off")
Since R2025a
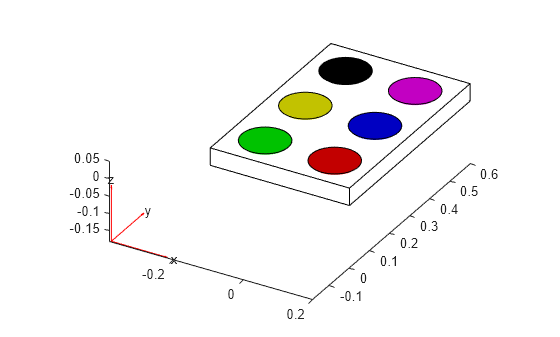
Create a plot showing a watercolor paint set with two rows, each containing three pans of paint. First, create the geometry representing the container for the paint set.
L = 0.6;
W = 0.4;
H = 0.05;
g = multicuboid(W,L,H);
g = fegeometry(translate(g,[0,L/2,0]));
Create the geometry representing an individual pan of paint.
gPan = fegeometry(multicylinder(W/6,H/2));
Create a vector containing the colors you want to use for the six pans of paint. For example, specify these colors.
color = ["red","green","blue","yellow","magenta","black"];
Specify the gap from the edge of the container to the first pan.
edgeGap = 0.1;
Plot the container and specify white as the face color. Use the vector color to specify the face colors for the pans of paint.
pdegplot(g,FaceColor="white")
hold on
i = 1;
for k=linspace(edgeGap,L-edgeGap,3) % 3 pans in a row
    gColor = translate(gPan,[edgeGap,k,1.01*H/2]);
    pdegplot(gColor,FaceColor=color(i))
    hold on
    i = i + 1;
    % Mirror the geometry to create a pan in the second row.
    gColor = scale(gColor,[-1 1 1]);
    pdegplot(gColor,FaceColor=color(i))
    hold on
    i = i + 1;
end
Since R2026a
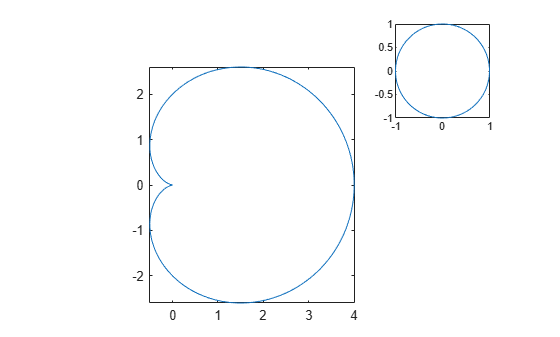
Position two Axes objects in a figure and add a geometry plot to each one.
Specify the position of the first Axes object so that it has a lower left corner at the point (0.1 0.1) with a width and height of 0.7. Specify the position of the second Axes object so that it has a lower left corner at the point (0.65 0.65) with a width and height of 0.28. By default, the values are normalized to the figure. Return the Axes objects as ax1 and ax2.
ax1 = axes(Position=[0.1 0.1 0.7 0.7]);
ax2 = axes(Position=[0.65 0.65 0.28 0.28]);
Add a geometry plot to each Axes object. Specify the axes by passing it as the first input argument to the pdegplot function.
pdegplot(ax1,@cardg)
pdegplot(ax2,@circleg)
Input Arguments
Name-Value Arguments
Output Arguments
Alternative Functionality
App
If you create a 2-D geometry in the PDE Modeler app, you can view the geometry from Boundary Mode. To see the edge labels, select Boundary > Show Edge Labels. To see the face labels, select PDE > Show Subdomain Labels.