optimplot を使用した解法プロセスの監視
この例では、optimplot プロット関数を使用して、解法プロセスのいくつかの側面を監視する方法を示します。
メモ: 現在、optimplot は fmincon ソルバーに対してのみ使用できます。
問題の定義と最初の解
問題は、次の 2 変数の目的関数を最小化することです。
領域は 、、 です。最適化変数を使用してこの問題を表します。
x = optimvar("x",LowerBound=-5);
y = optimvar("y",LowerBound=-5);
prob = optimproblem;
prob.Objective = (x+y)*exp(-y);
prob.Constraints = (y + x^2)^2 + 0.1*y^2 <= 1;
初期点 を設定します。
x0.x = 1;
x0.y = -3/2;
どのソルバーが solve の呼び出しを行うでしょうか。
defaultSolver = solvers(prob)
defaultSolver =
"fmincon"
optimplot プロット関数を使用するための fmincon オプションを設定し、問題を解きます。
opts = optimoptions("fmincon",PlotFcn="optimplot");
[sol,fval,eflag,output] = solve(prob,x0,Options=opts);
Solving problem using fmincon.
Local minimum found that satisfies the constraints.

Optimization completed because the objective function is non-decreasing in
feasible directions, to within the value of the optimality tolerance,
and constraints are satisfied to within the value of the constraint tolerance.

<stopping criteria details>
プロットの詳細
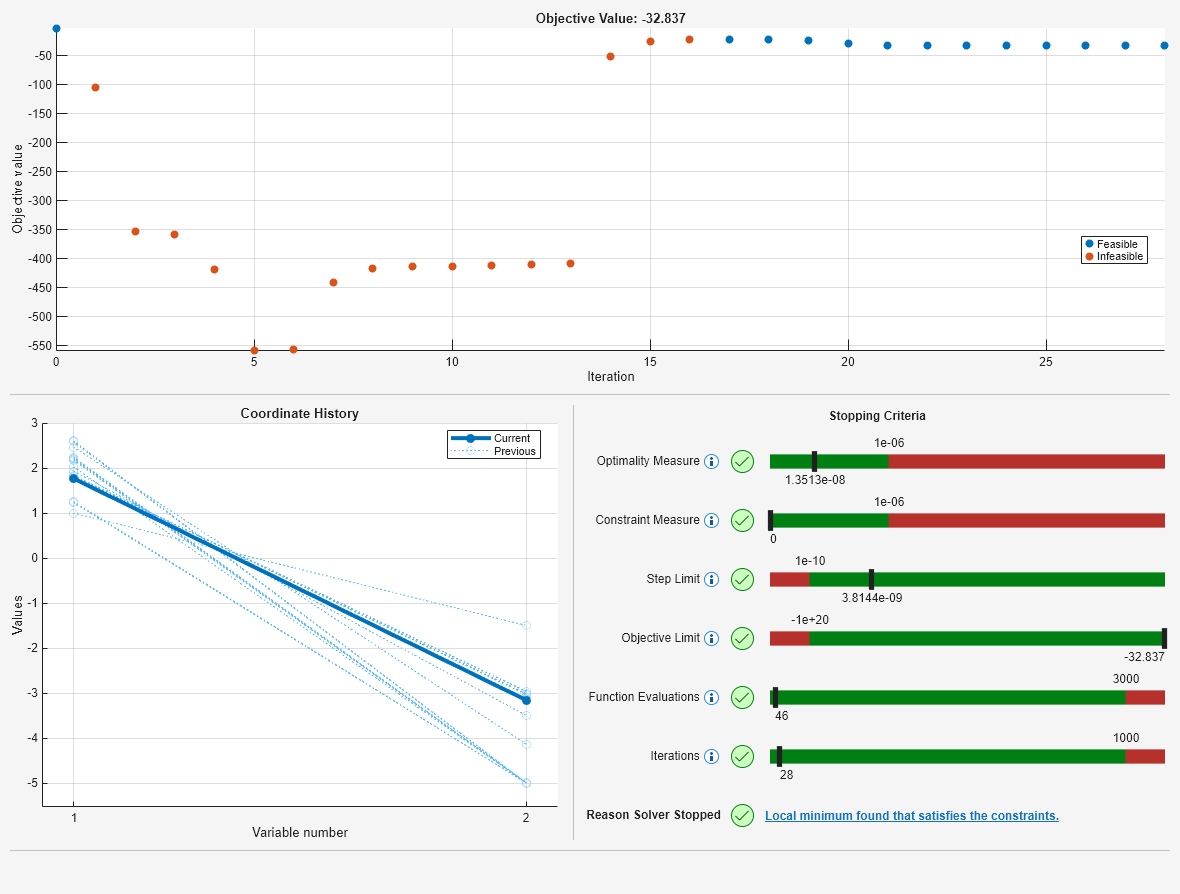
プロットの各セクションを確認します。まずは一番上のセクションを確認します。
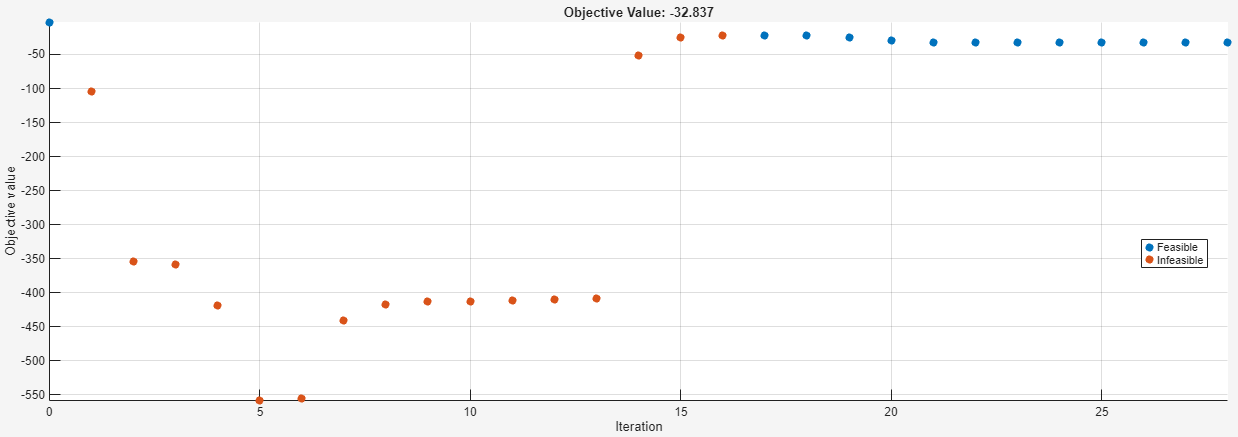
このプロットでは、初期点 (左上) が青い点としてプロットされているため、この点が実行可能であることがわかります。"実行可能" とは点がすべての制約を満たすことを意味し、"実行不可能" とは点が 1 つ以上の制約を満たさないことを意味します。次のいくつかの点は赤い点で、実行不可能であることを意味します。プロットの右側の部分に含まれる点はすべて青い点で、実行可能な反復を示しています。
次に、左下のセクションの変数プロットを確認します。
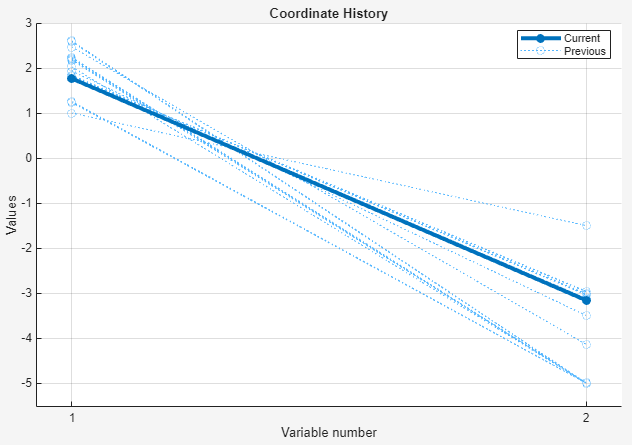
最終点は太いラインとしてプロットされています。中間の反復は薄い点線としてプロットされています。
最後に、停止条件が示されている右下のセクションを確認します。
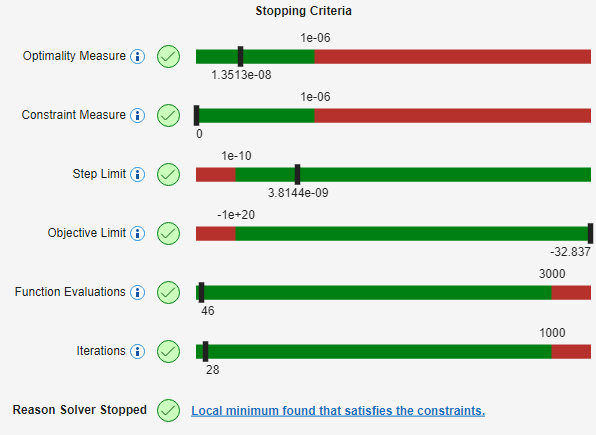
このセクションには次の情報が表示されています。
最適性の尺度 --- このバーは、1 次の最適性の尺度が満たされていることを示しています。マーカーが緑の領域にあり、値が
OptimalityToleranceの値 1e–6 を下回っています。この許容誤差により、ソルバーが停止しました。制約の尺度 --- このバーは、制約がすべて
ConstraintToleranceの値 1e–6 の範囲内で満たされていることを示しています。この許容誤差は実際の停止条件ではありません。代わりに、ソルバーは制約が満たされていない場合に続行しようとします。ステップの制限 --- このバーは、ソルバーが
StepTolerance許容誤差によって停止されなかったことを示しています。目的の制限 --- このバーは、ソルバーが
ObjectiveLimit許容誤差によって停止されなかったことを示しています。関数評価回数 --- このバーは、ソルバーが
MaxFunctionEvaluations許容誤差によって停止されなかったことを示しています。反復回数 --- このバーは、ソルバーが
MaxIterations許容誤差によって停止されなかったことを示しています。
ソルバーは停止条件の相対値またはスケーリングされた値を使用できることに注意してください。詳細については、許容誤差の詳細を参照してください。
プロットの 3 つのセクションは同期されています。一番上のセクションの点をクリックすると、3 つすべてのセクションにその点に関連付けられた値が表示されます。5 番目の反復点をクリックします。
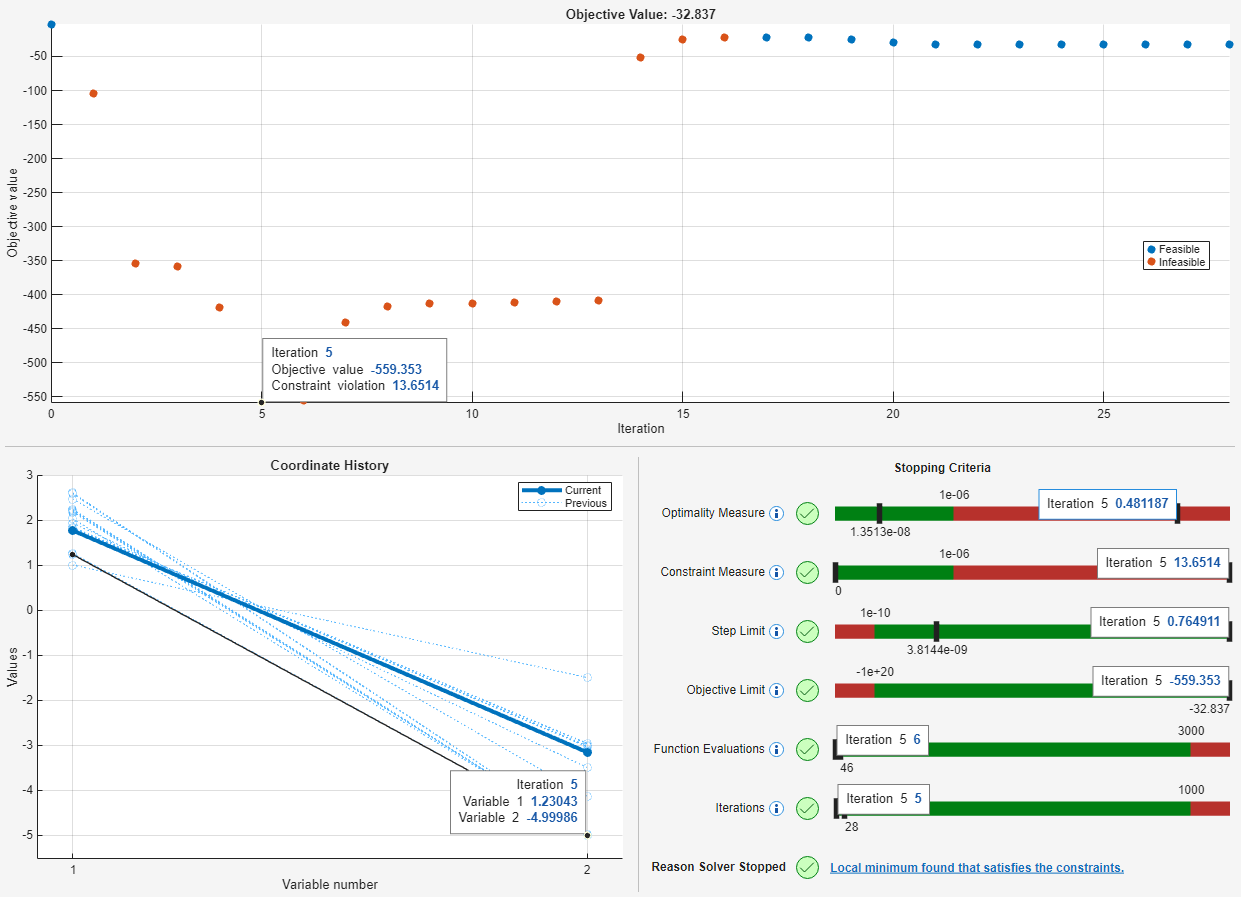
5 番目の反復点は最小目的関数値をもちます。ただし、この点は実行可能ではありません。一番上のセクションからわかるように、この点は赤色でプロットされており、制約違反が 13 を超えています。[停止条件] セクションの [制約の尺度] バーに同じ違反の値が表示されており、ここでもその点が実行不可能であることがわかります。5 番目の反復について表示された値を削除するには、その点をもう一度クリックします。
動的なプロット範囲
ソルバー実行中の初期段階の反復では、初期点が表示されていませんでした。以下は、7 番目の反復後に一時停止したプロット関数をクローズアップしたものです。
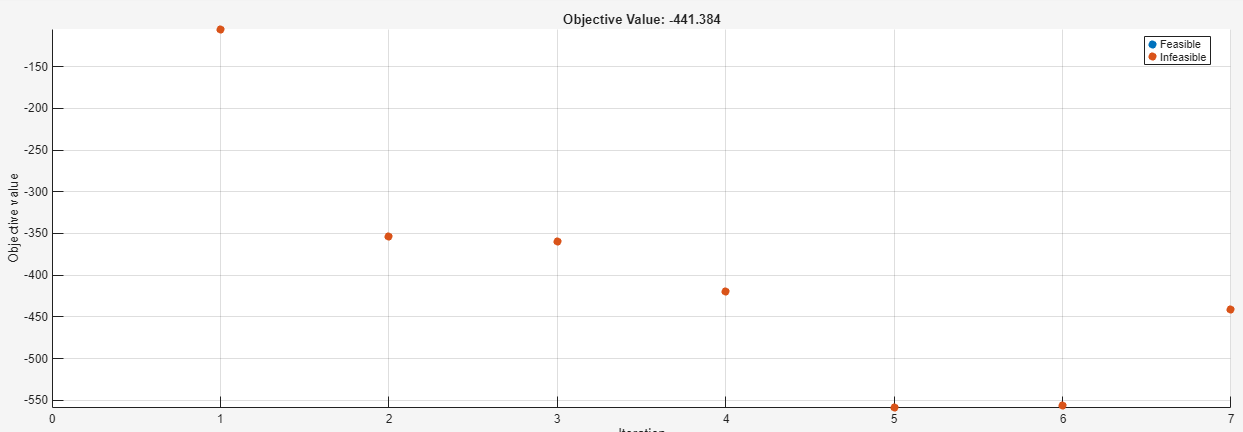
反復 0 の点はプロット範囲外にあるため、プロットされていません。optimplot プロット関数は、収束が観測しやすくなるように、反復の進行に応じて関連する範囲を表示しようとします。
より良い解の検索
[停止条件] セクションの下部に、ソルバーの停止理由が示され、詳細な情報のリンクが提供されます。
![]()
このリンクをクリックすると、次の情報とリンクが表示されます。
![]()
[ソルバーが成功する場合] というリンクをクリックします。結果として得られるドキュメンテーション ページの最初の提案は、初期点を変更することです。そのため、初期点を変更してより良い解を検索します。
x0.x = -1;
x0.y = -1;
[sol2,fval2,eflag2,output2] = solve(prob,x0,Options=opts);
Solving problem using fmincon.
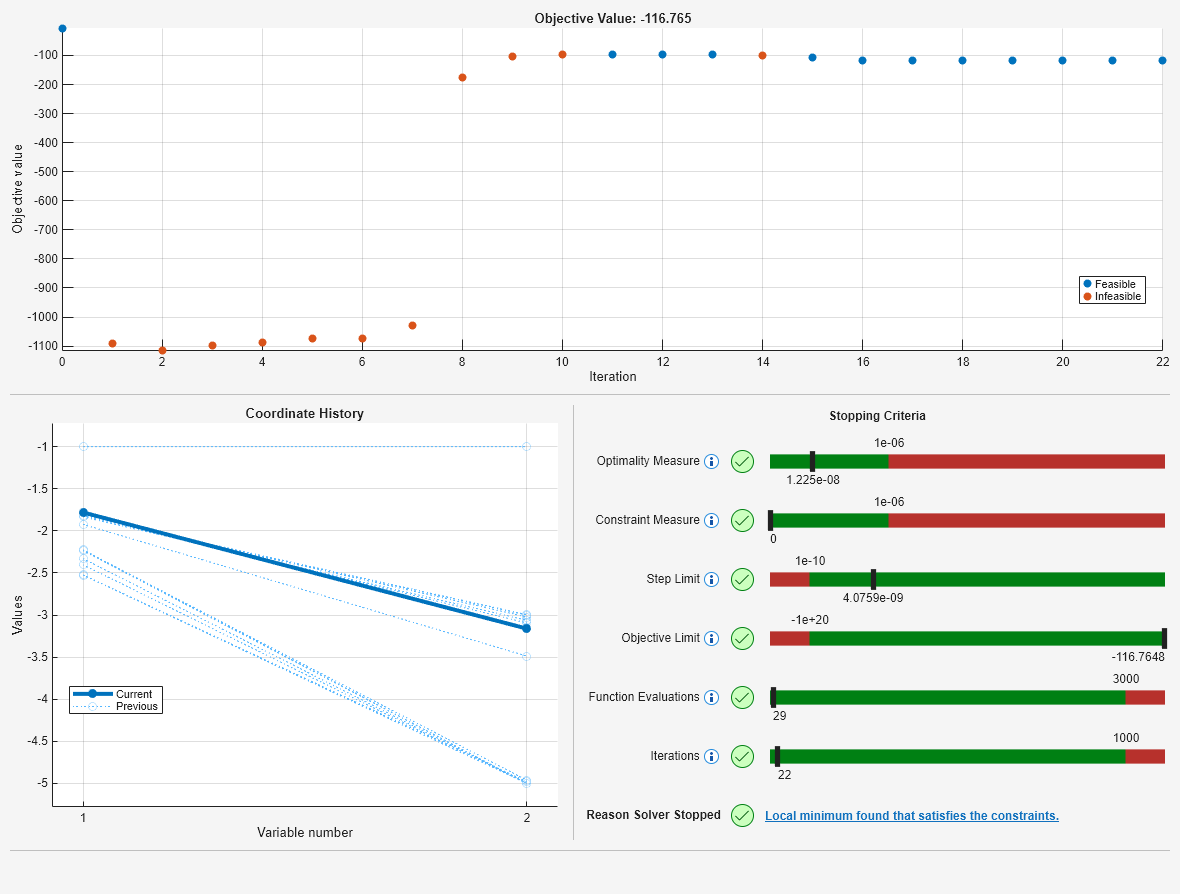
Local minimum found that satisfies the constraints.

Optimization completed because the objective function is non-decreasing in
feasible directions, to within the value of the optimality tolerance,
and constraints are satisfied to within the value of the constraint tolerance.

<stopping criteria details>
今回は、fmincon が目的関数の値 に達していることがプロットからわかります。この値は、最初の解における値である より良く (小さく) なっています。
結論
optimplot プロット関数は、ソルバーの反復に関連付けられた多くの統計を示します。1 つのプロットで、反復点の実行可能性、反復の停止に使用されるさまざまな尺度、および反復点の座標を確認でき、後の方の点は太くプロットされます。ただし、optimplot プロット関数では、表示される解が大域的な解であることが保証されません。この例の最初の解は局所的な解であり、大域的な解ではありません。結果を適切に解釈するには、引き続き的確な判断が必要です。