plot
説明
plot( は、計画内のタスクを依存関係グラフとしてプロットします。このグラフでは、ノードがタスクを表し、エッジが依存関係を表します。グラフ内のエッジは、依存するタスクから依存されるタスクに流れます。 plan)
プロットは、計画を有向非循環グラフとして可視化します。循環を含めることはできません。
plot( は、タスク グループ内のタスクを表示するかどうかを指定します。plan,ShowAllTasks=tf)tf が true の場合、メソッドはタスク グループの内容をタスク グラフに含めます。タスク グループの詳細については、Create Groups of Similar Tasksを参照してください。 (R2024b 以降)
入力引数
例
ビルド計画内のタスクを依存関係グラフとしてプロットします。
例を開き、plot_plan_example フォルダーに移動します。このフォルダーには、ビルド ファイルと、explore.c および yprime.c という名前の 2 つの C ソース ファイルが含まれています。
cd plot_plan_example次のコードは、ビルド ファイルの内容を示しています。
"clean"タスクは、ビルド ファイル内の他のタスクの出力とトレースを削除します。"mex"タスク グループには、"mex:explore"と"mex:yprime"という名前の 2 つのタスクが含まれています。これらの各タスクは、ソース ファイルを MEX ファイルにコンパイルし、現在のフォルダー内のoutputという名前のフォルダーに結果を保存します。"mex"タスク グループを実行するには、サポートされる C コンパイラがシステムにインストールされていなければなりません。"archive"タスクは、入力のアーカイブを作成します。
function plan = buildfile
import matlab.buildtool.tasks.CleanTask
import matlab.buildtool.tasks.MexTask

% Create a plan from task functions
plan = buildplan(localfunctions);

% Add a task to delete outputs and traces
plan("clean") = CleanTask;

% Add a task group to build MEX files
plan("mex:explore") = MexTask("explore.c","output");
plan("mex:yprime") = MexTask("yprime.c","output");

plan("mex").Description = "Build MEX files";

% Specify the inputs and outputs of the "archive" task
plan("archive").Inputs = [plan("mex").Tasks.MexFile];
plan("archive").Outputs = "mex.zip";
end

function archiveTask(context)
% Create ZIP file
task = context.Task;
zip(task.Outputs.paths,task.Inputs.paths)
end
ビルド ファイルから計画を読み込みます。
plan = buildfile
plan =
  Plan with tasks:

    archive - Create ZIP file
    clean   - Delete task outputs and traces
    mex     - Build MEX files

  Show all tasks
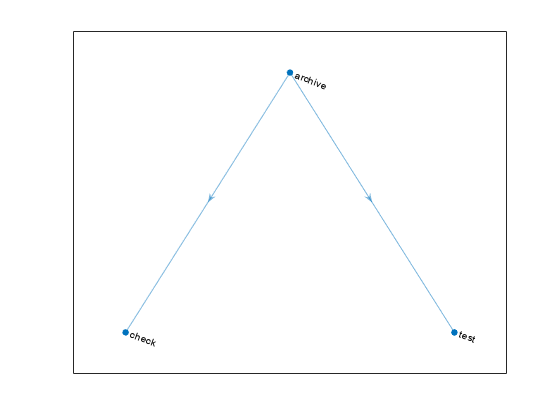
計画内のタスクを依存関係グラフとしてプロットします。グラフには、"clean" タスク、"mex" タスク グループ、および "archive" タスクがノードとして表示されます。ただし、"mex" タスク グループ内のタスクは含まれていません。"archive" タスクの入力は "mex" タスク グループの出力であるため、グラフにはこの依存関係を表す矢印も含まれています。
plot(plan)
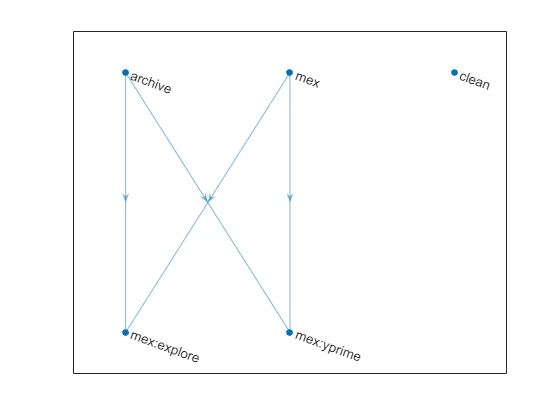
"mex" タスク グループ内の "mex:explore" タスクおよび "mex:yprime" タスクを含む、計画内のすべてのタスクをプロットします。
plot(plan,ShowAllTasks=true)