Main Content

allcycles

グラフ内のすべての循環の検出

R2021a 以降

説明

cycles = allcycles(G) は、指定したグラフ内のすべての循環を返します。出力 cycles は cell 配列で、各 cell cycles{k} の内容は 1 つの循環を形成するノードのリストになります。

[cycles,edgecycles] = allcycles(G) は、各循環内のエッジも返します。出力 edgecycles は cell 配列で、edgecycles{k} は対応する循環 cycles{k} にあるエッジを示します。

[___] = allcycles(G,Name,Value) は、1 つ以上の名前と値の引数を使用して追加のオプションを指定します。前述の構文にある任意の出力引数の組み合わせが使用できます。たとえば、MaxNumCycles とスカラーを指定して、返される循環の数を制限できます。

すべて折りたたむ

9 つのノードをもつ有向グラフを作成します。グラフをプロットします。

s = [1 2 3 6 5 5 4 6 9 8 8 7];
t = [2 3 6 5 2 4 1 9 8 5 7 4];
G = digraph(s,t);
plot(G)

Figure contains an axes object. The axes object contains an object of type graphplot.

グラフ内のすべての循環を計算します。

cycles = allcycles(G)
cycles=5×1 cell array
    {[    1 2 3 6 5 4]}
    {[1 2 3 6 9 8 5 4]}
    {[1 2 3 6 9 8 7 4]}
    {[        2 3 6 5]}
    {[    2 3 6 9 8 5]}

allcycles の 2 番目の出力引数は、各循環に含まれているエッジを返します。これは、多重グラフにおいて、各循環内のエッジを一意に識別するためにエッジ インデックスが必要な場合に特に便利です。

8 つのノードと 18 本のエッジをもつ有向多重グラフを作成します。ノードの名前を指定します。ラベル付きのノードとエッジを使用してグラフをプロットします。

s = [1 1 2 2 3 3 2 2 4 6 8 6 6 7 3 3 5 3];
t = [2 3 1 3 2 1 4 4 6 2 6 7 8 8 5 5 7 7];
names = {'A','B','C','D','E','F','G','H'};
G = digraph(s,t,[],names);
p = plot(G,'EdgeLabel',1:numedges(G));

Figure contains an axes object. The axes object contains an object of type graphplot.

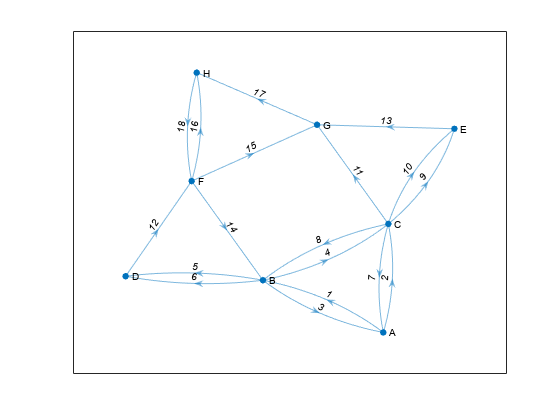
グラフ内のすべての循環を計算します。2 つの出力引数を指定して、各循環にあるエッジのエッジ インデックスも返します。

[cycles,edgecycles] = allcycles(G);

5 番目の循環内のノードおよびエッジを表示します。

cycles{5}
ans = 1x7 cell
    {'A'}    {'C'}    {'E'}    {'G'}    {'H'}    {'F'}    {'B'}

edgecycles{5}
ans = 1×7

     2     9    13    17    18    14     3

5 番目の循環内のノードおよびエッジを強調表示します。

highlight(p,'Edges',edgecycles{5},'EdgeColor','r','LineWidth',1.5,'NodeColor','r','MarkerSize',6)

Figure contains an axes object. The axes object contains an object of type graphplot.

オプションの 'MaxNumCycles''MaxCycleLength'、および 'MinCycleLength' を使用して、allcycles で返される循環の数を制限します。

20 個のノードをもつ完全グラフの隣接行列を作成します。隣接行列から、自己ループは省略して無向グラフを作成します。

A = ones(20);
G = graph(A,'omitselfloops');

グラフのすべてのノードが他のすべてのノードと連結されるため、グラフに多数の循環が存在します (1.7e17 を超えます)。そのため、結果がメモリに収まらず、すべての循環を計算することはできなくなります。代わりに、最初の 10 個の循環を計算します。

cycles1 = allcycles(G,'MaxNumCycles',10)
cycles1=10×1 cell array
    {[                     1 2 3]}
    {[                   1 2 3 4]}
    {[                 1 2 3 4 5]}
    {[               1 2 3 4 5 6]}
    {[             1 2 3 4 5 6 7]}
    {[           1 2 3 4 5 6 7 8]}
    {[         1 2 3 4 5 6 7 8 9]}
    {[      1 2 3 4 5 6 7 8 9 10]}
    {[   1 2 3 4 5 6 7 8 9 10 11]}
    {[1 2 3 4 5 6 7 8 9 10 11 12]}

次に、循環の長さが 3 以下である最初の 10 個の循環を計算します。

cycles2 = allcycles(G,'MaxNumCycles',10,'MaxCycleLength',3)
cycles2=10×1 cell array
    {[ 1 2 3]}
    {[ 1 2 4]}
    {[ 1 2 5]}
    {[ 1 2 6]}
    {[ 1 2 7]}
    {[ 1 2 8]}
    {[ 1 2 9]}
    {[1 2 10]}
    {[1 2 11]}
    {[1 2 12]}

最後に、循環の長さが 4 以上である最初の 10 個の循環を計算します。

cycles3 = allcycles(G,'MaxNumCycles',10,'MinCycleLength',4)
cycles3=10×1 cell array
    {[                      1 2 3 4]}
    {[                    1 2 3 4 5]}
    {[                  1 2 3 4 5 6]}
    {[                1 2 3 4 5 6 7]}
    {[              1 2 3 4 5 6 7 8]}
    {[            1 2 3 4 5 6 7 8 9]}
    {[         1 2 3 4 5 6 7 8 9 10]}
    {[      1 2 3 4 5 6 7 8 9 10 11]}
    {[   1 2 3 4 5 6 7 8 9 10 11 12]}
    {[1 2 3 4 5 6 7 8 9 10 11 12 13]}

関数 cyclebasis および allcycles の出力がグラフ内のエッジ数の変化に伴ってどのように増減するのかを調べます。

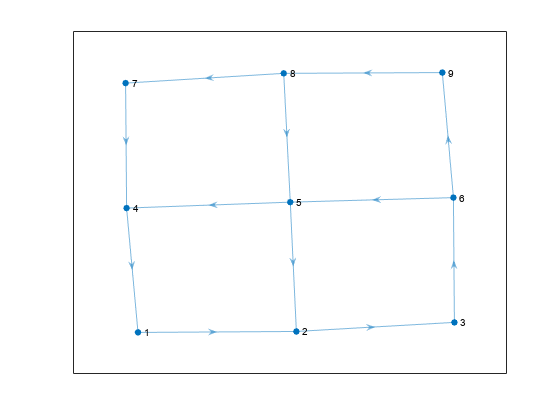
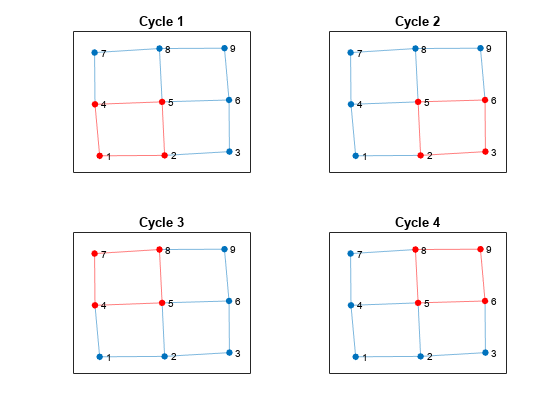
正方形の各辺に 3 つのノードがある正方形グリッド グラフを作成してプロットします。

n = 5;
A = delsq(numgrid('S',n));
G = graph(A,'omitselfloops');
plot(G)

Figure contains an axes object. The axes object contains an object of type graphplot.

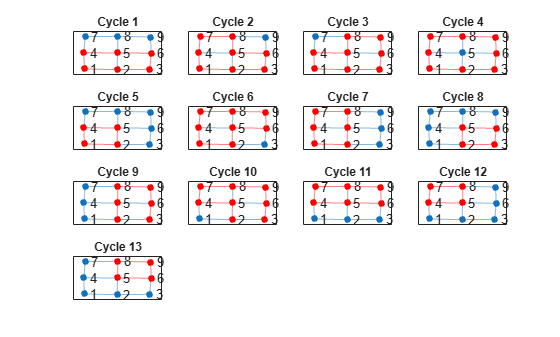
allcycles を使用してグラフ内のすべての循環を計算します。関数 tiledlayout を使用して、サブプロットの配列を作成し、サブプロット内の各循環を強調表示します。グラフ内に合計 13 個の循環があることが結果に示されます。

[cycles,edgecycles] = allcycles(G);
tiledlayout flow
for k = 1:length(cycles)
    nexttile
    highlight(plot(G),cycles{k},'Edges',edgecycles{k},'EdgeColor','r','NodeColor','r')
    title("Cycle " + k)
end

Figure contains 13 axes objects. Axes object 1 with title Cycle 1 contains an object of type graphplot. Axes object 2 with title Cycle 2 contains an object of type graphplot. Axes object 3 with title Cycle 3 contains an object of type graphplot. Axes object 4 with title Cycle 4 contains an object of type graphplot. Axes object 5 with title Cycle 5 contains an object of type graphplot. Axes object 6 with title Cycle 6 contains an object of type graphplot. Axes object 7 with title Cycle 7 contains an object of type graphplot. Axes object 8 with title Cycle 8 contains an object of type graphplot. Axes object 9 with title Cycle 9 contains an object of type graphplot. Axes object 10 with title Cycle 10 contains an object of type graphplot. Axes object 11 with title Cycle 11 contains an object of type graphplot. Axes object 12 with title Cycle 12 contains an object of type graphplot. Axes object 13 with title Cycle 13 contains an object of type graphplot.

一部の循環は、小さい循環の組み合わせと見なすことができます。関数 cyclebasis は、グラフ内の他のすべての循環の基底となる循環のサブセットを返します。cyclebasis を使用して、基本循環基底を計算し、サブプロットで各基本循環を強調表示します。グラフ内には 13 個の循環がありますが、基本循環は 4 つのみです。

[cycles,edgecycles] = cyclebasis(G);
tiledlayout flow
for k = 1:length(cycles)
    nexttile
    highlight(plot(G),cycles{k},'Edges',edgecycles{k},'EdgeColor','r','NodeColor','r')
    title("Cycle " + k)
end

Figure contains 4 axes objects. Axes object 1 with title Cycle 1 contains an object of type graphplot. Axes object 2 with title Cycle 2 contains an object of type graphplot. Axes object 3 with title Cycle 3 contains an object of type graphplot. Axes object 4 with title Cycle 4 contains an object of type graphplot.

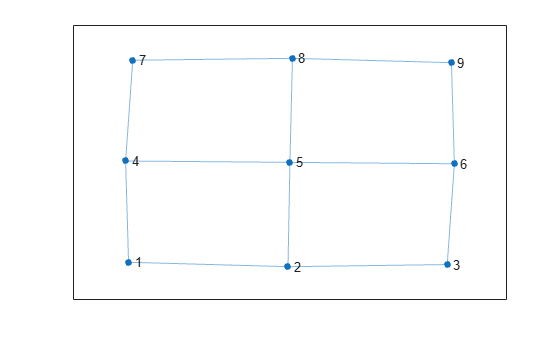
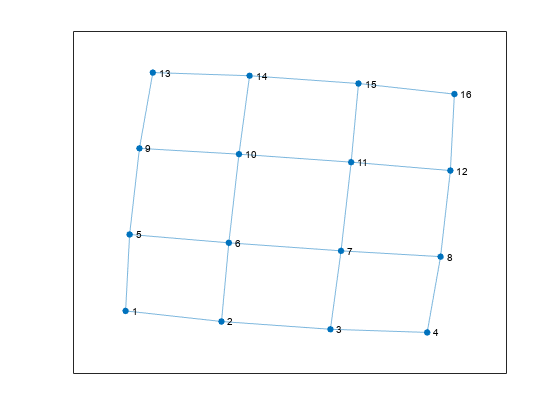
次に、正方形グラフの各辺上のノード数を 3 から 4 に増やします。これにより、グラフのサイズが少し大きくなります。

n = 6;
A = delsq(numgrid('S',n));
G = graph(A,'omitselfloops');
figure
plot(G)

Figure contains an axes object. The axes object contains an object of type graphplot.

allcycles を使用して新しいグラフ内のすべての循環を計算します。このグラフでは、循環数は 200 を超えており、プロットするには多すぎます。

allcycles(G)
ans=213×1 cell array
    {[                       1 2 3 4 8 7 6 5]}
    {[                  1 2 3 4 8 7 6 10 9 5]}
    {[1 2 3 4 8 7 6 10 11 12 16 15 14 13 9 5]}
    {[      1 2 3 4 8 7 6 10 11 15 14 13 9 5]}
    {[            1 2 3 4 8 7 6 10 14 13 9 5]}
    {[                 1 2 3 4 8 7 11 10 6 5]}
    {[                 1 2 3 4 8 7 11 10 9 5]}
    {[           1 2 3 4 8 7 11 10 14 13 9 5]}
    {[     1 2 3 4 8 7 11 12 16 15 14 10 6 5]}
    {[     1 2 3 4 8 7 11 12 16 15 14 10 9 5]}
    {[     1 2 3 4 8 7 11 12 16 15 14 13 9 5]}
    {[1 2 3 4 8 7 11 12 16 15 14 13 9 10 6 5]}
    {[           1 2 3 4 8 7 11 15 14 10 6 5]}
    {[           1 2 3 4 8 7 11 15 14 10 9 5]}
    {[           1 2 3 4 8 7 11 15 14 13 9 5]}
    {[      1 2 3 4 8 7 11 15 14 13 9 10 6 5]}
      ⋮

グラフには多数の循環がありますが、この場合も cyclebasis で返される基本循環は少数です。わずか 9 個の基本循環を使用することで、グラフ内のすべての循環を作成できます。

[cycles,edgecycles] = cyclebasis(G);
figure
tiledlayout flow
for k = 1:length(cycles)
    nexttile
    highlight(plot(G),cycles{k},'Edges',edgecycles{k},'EdgeColor','r','NodeColor','r')
    title("Cycle " + k)
end

Figure contains 9 axes objects. Axes object 1 with title Cycle 1 contains an object of type graphplot. Axes object 2 with title Cycle 2 contains an object of type graphplot. Axes object 3 with title Cycle 3 contains an object of type graphplot. Axes object 4 with title Cycle 4 contains an object of type graphplot. Axes object 5 with title Cycle 5 contains an object of type graphplot. Axes object 6 with title Cycle 6 contains an object of type graphplot. Axes object 7 with title Cycle 7 contains an object of type graphplot. Axes object 8 with title Cycle 8 contains an object of type graphplot. Axes object 9 with title Cycle 9 contains an object of type graphplot.

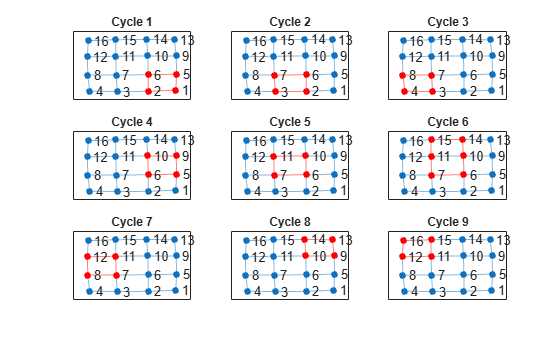
グラフのサイズを少しだけ変更したときに循環数が大幅に増加することは、一部のグラフ構造ではよくあることです。allcycles で返される循環の数は、グラフ内のエッジの数の増加に伴って指数関数的に多くなることがあります。しかし、cyclebasis で返される循環の数は、グラフ内のエッジ数の増加に伴って最大でも線形的に増加するだけです。

入力引数

すべて折りたたむ

入力グラフ。graph オブジェクトまたは digraph オブジェクトとして指定します。無向グラフの作成には graph を、有向グラフの作成には digraph を使用します。

例: G = graph(1,2)

例: G = digraph([1 2],[2 3])

名前と値の引数

引数のオプションのペアを Name1=Value1,...,NameN=ValueN として指定します。ここで Name は引数名で、Value は対応する値です。名前と値の引数は他の引数の後になければなりませんが、ペアの順序は重要ではありません。

R2021a より前では、コンマを使用してそれぞれの名前と値を区切り、Name を引用符で囲みます。

例: allcycles(G,'MaxNumCycles',100) は、グラフ内の最初の 100 個の循環のみを返します。

循環の最大数。'MaxNumCycles' と非負の整数スカラーで構成されるコンマ区切りのペアとして指定します。このオプションは、グラフ内の循環の数がメモリ制限に達するほど多くなる場合に便利です。MaxNumCycles を指定して、使用可能なメモリ内に結果が収まるように allcycles で返される循環の数を制限できます。

例: allcycles(G,'MaxNumCycles',100)

最大の循環の長さ。'MaxCycleLength' と正の整数スカラーで構成されるコンマ区切りのペアとして指定します。このオプションは、指定した制限を超える長さの循環が返されないように allcycles で返される結果をフィルター処理します。循環の長さはエッジの数で測定され、エッジの重みは無視されます。

特定の範囲の長さの循環を検出するには、'MaxCycleLength''MinCycleLength' の両方を指定します。指定した正確な長さの循環を検出するには、'MaxCycleLength''MinCycleLength' の両方に同じ値を指定します。

例: allcycles(G,'MaxCycleLength',4) は、長さが 4 以下の循環を返します。

例: allcycles(G,'MinCycleLength',3,'MaxCycleLength',5) は、長さが 3、4、5 の循環を返します。

最小の循環の長さ。'MinCycleLength' と正の整数スカラーで構成されるコンマ区切りのペアとして指定します。このオプションは、指定した制限に満たない長さの循環が返されないように allcycles で返される結果をフィルター処理します。循環の長さはエッジの数で測定され、エッジの重みは無視されます。

特定の範囲の長さの循環を検出するには、'MaxCycleLength''MinCycleLength' の両方を指定します。指定した正確な長さの循環を検出するには、'MaxCycleLength''MinCycleLength' の両方に同じ値を指定します。

例: allcycles(G,'MinCycleLength',2) は、長さが 2 以上の循環を返します。

例: allcycles(G,'MinCycleLength',3,'MaxCycleLength',5) は、長さが 3、4、5 の循環を返します。

出力引数

すべて折りたたむ

グラフの循環。cell 配列として返されます。各要素 cycles{k} に、G 内の循環のいずれかに属するノードが含まれます。各循環はノード インデックスが最も小さいノードから開始し、循環は辞書的順序で返されます。無向グラフ内の循環は 1 回だけ返され、その後に単一の方向が返されます。G に循環が含まれていない場合、cycles は空です。

cycles の cell のデータ型は、入力グラフにノード名が含まれているかどうかによって次のように異なります。

  • グラフ G にノード名が含まれていない場合、各要素 cycles{k} はノード インデックスの数値ベクトルになります。

  • グラフ G にノード名が含まれている場合、各要素 cycles{k} はノード名の文字ベクトルの cell 配列になります。

各循環内のエッジ。cell 配列として返されます。各要素 edgecycles{k} に、対応する循環 cycles{k} にあるエッジのエッジ インデックスが格納されます。G に循環が含まれていない場合、edgecycles は空です。

詳細

すべて折りたたむ

グラフの循環

グラフに循環が存在するのは、最初と最後のノードのみが繰り返される空でない経路がある場合です。つまり、最初のノードがパスの最後で繰り返されて循環を閉じる以外に、他のノードは繰り返されません。循環は、たとえば (Node1 - Node2 - Node3 - Node1) のようになります。慣例により、allcycles は循環内の最後のノードを返しません。これは最初のノードと同じであるためです。

循環が同じエッジを 2 回通過することはありません。たとえば、無向グラフに循環 (Node1 - Node2 - Node1) が存在するのは、Node1 と Node2 を連結するエッジが複数ある場合のみになります。この定義により、自己ループは循環としてカウントされますが、それよりも大きい循環の一部となることはありません。

ヒント

  • グラフ内の循環の数は、グラフの構造によって大きく異なります。一部のグラフ構造では、循環の数がノードの数に応じて指数関数的に多くなることがあります。たとえば、G = graph(ones(12)) で与えられる 12 個のノードをもつ完全グラフには、6,000 万個近い循環があります。このような場合は、MaxNumCyclesMaxCycleLength、および MinCycleLength の各オプションを使用して allcycles の出力を制御します。

バージョン履歴

R2021a で導入