Experiment Manager
Description
You can use the Experiment Manager app to create experiments to run your MATLAB® code using various parameter values and compare results. For example, you can use Experiment Manager to explore how the solution to a system of differential equations responds to different coefficient values or how it evolves from different initial conditions.
Experiment Manager helps you set up, execute, and interpret experiments by:
Organizing multiple experiments and the experiment artifacts and results in projects
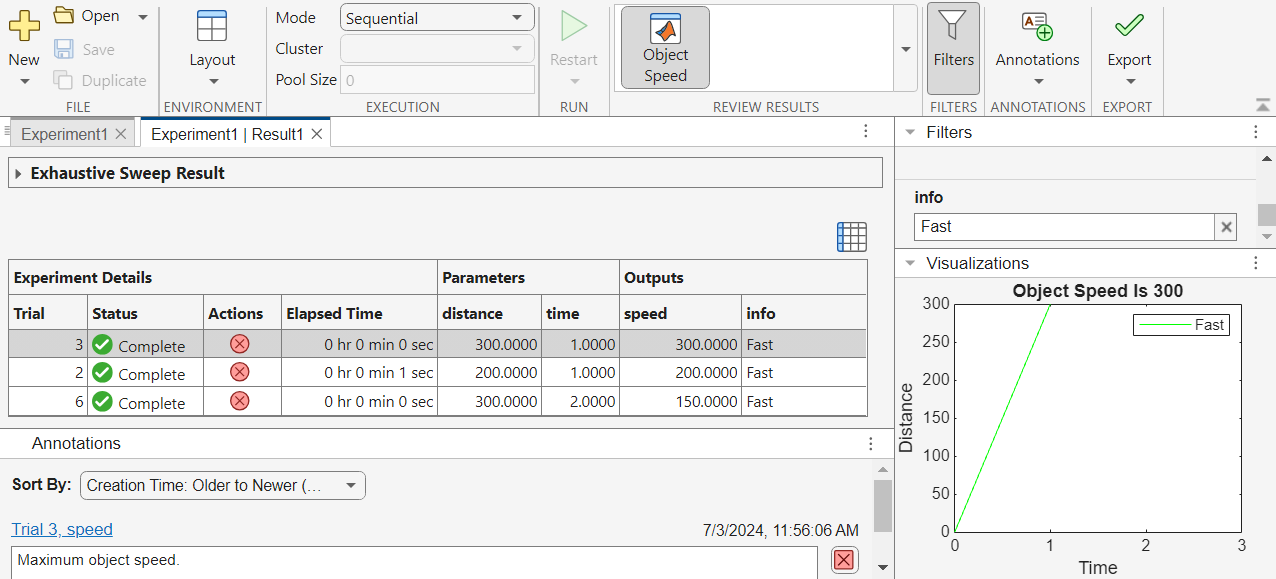
Providing visualizations, filters, and annotations for comparing results
Storing the experiment definition and parameter combinations for each experiment result
For more information about setting up experiments, watch How to Set Up and Manage Experiments in MATLAB.
Open the Experiment Manager App
MATLAB Toolstrip: On the Apps tab, under MATLAB, click the Experiment Manager icon.
MATLAB command prompt: Enter
experimentManager.
Examples
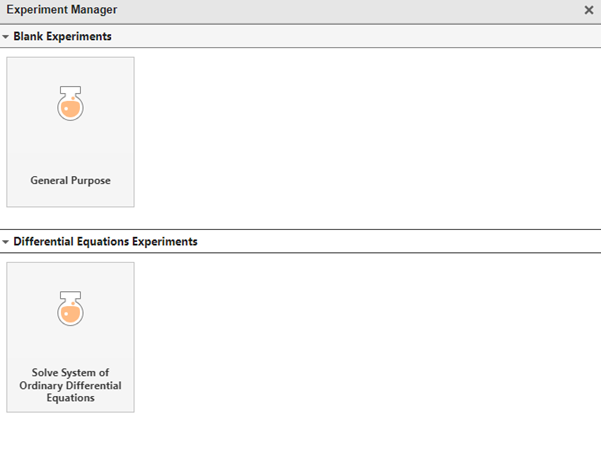
When you open the Experiment Manager, the Experiment Manager Start Page appears.
To create an experiment, create or open a project to contain your experiment. Then,
select one of these general-purpose experiment templates, indicated by the ![]() icon. A general-purpose experiment is an experiment
that executes an experiment function that you author and captures the outputs that the
experiment function returns.
icon. A general-purpose experiment is an experiment
that executes an experiment function that you author and captures the outputs that the
experiment function returns.
General Purpose — Create a blank general-purpose experiment.
Solve System of Ordinary Differential Equations — Create a general-purpose experiment that solves a system of ordinary differential equations by sweeping over the values of two parameters. (since R2024b)
To learn more about how to configure an experiment using Experiment Manager, see Explore Parameters Using Simple Computational Experiment.
Note
If you have other toolboxes installed, you can also create a built-in training or custom training experiment. For more information, see the Tips section.
Each time you run an experiment, you can change parameter values and modify functions. This flexibility allows you to explore different configurations and their effects on your results. After running an experiment, you can access or revert to the parameter values and the specific version of the functions that produced those results.
To access the artifacts for an experiment result, in the Experiment Browser panel, double-click the name of the set of results. Then, in the Result tab, click View Experiment Source.
Open files located in the project folder that are used by the result by clicking the links at the bottom of the Source tab. These files are read-only, but you can copy them to the project folder, rerun the experiment, and reproduce your results.
Related Examples
Parameters
Enter a description of the experiment.
The initialization function is a function that you create to configure data or other experiment details before initiating the trial runs. Create a new blank initialization function by clicking New, or open and modify an existing initialization function by clicking Edit.
The function cannot accept any inputs. The function must return one output argument,
such as a scalar value or a structure array. Access the initialization function output
in your experiment function by using
params.InitializationFunctionOutput. For more information, see
Optimize Experiment Performance Using Initialization Function.
Enter the names and values of the parameters used in the experiment function.
To include a new parameter, click Add.
For some experiment templates, you have the option to add a parameter from a list of suggested relevant parameters. To do this, click Add > Add From Suggested List. Select the desired parameters and add them to your experiment.
Parameter names must start with a letter, followed by letters, digits, or underscores.
Example: distance
Example: a_2
Parameter values must be scalars or vectors. Experiment Manager performs an exhaustive sweep by executing a trial for each unique combination of parameter values in the table.
Example: 0.01
Example: 0.01:0.01:0.05
Example: [0.01 0.02 0.04 0.08]
Example: ["alpha" "beta" "gamma"]
Data Types: double | single | int8 | int16 | int32 | int64 | uint8 | uint16 | uint32 | uint64 | logical | string | char
The experiment function is a function that you create to define your experiment and parameters. Experiment Manager runs the experiment function once for each unique combination of the parameter values. Create or modify the experiment function by clicking Edit.
The input variable is a structure params with fields from the
Parameters table. Access the parameter values using dot notation.
For example, if you add a parameter to the Parameters table with
the name distance, then use params.distance to
access it.
You can return outputs from your function. The variables names of your outputs
appear as column headers in the results table. For example, if your experiment function
returns the speed and info outputs, then the
results table also uses those variable
names.
[speed,info] = Experiment1Function1(params)

You can also add visualizations for your experiment by creating a figure in the
experiment function. You can specify the name of the visualization by setting the
Name property of the figure.
Identify, add, or remove files required by your experiment.
In most cases, Experiment Manager automatically detects required files and adds them to your project. The Detected Files list updates after you run the experiment or you click Refresh. The list displays the relative path for files in the project folder and the full path for files outside of the project folder.
If Experiment Manager does not detect some of your supporting files, your trials will produce an error. You can manually select files to include by clicking Add in the Additional Files section.
Tips
AI Workflows — If you have Deep Learning Toolbox™, you can configure an experiment for your AI workflow. For more information, see Experiment Manager (Deep Learning Toolbox).
Machine Learning Workflows — If you have Statistics and Machine Learning Toolbox™, you can configure an experiment using the Classification Learner or the Regression Learner app. You can also execute your experiment using the Bayesian optimization or random sampling strategy. For more information, see Experiment Manager (Statistics and Machine Learning Toolbox).
Parallel Workflows — If you have Parallel Computing Toolbox™, you can run multiple trials at the same time, or you can run a single trial on multiple GPUs, on a cluster, or in the cloud. For more information, see Run Experiments in Parallel. If you have MATLAB Parallel Server™, you can offload experiments as batch jobs to a remote cluster. For more information, see Offload Experiments as Batch Jobs to a Cluster.
Version History
Introduced in R2023bApply or reset a filter for a variable in the results table by selecting Filters in the toolstrip and configuring the corresponding section of the Filters panel. Set the bounds for a numeric variable, or specify the contents of a character array or string variable. Previously, you could apply a filter only to numeric variables and you could not reset the numeric filter.

See Also
Apps
- Experiment Manager (Deep Learning Toolbox) | Experiment Manager (Statistics and Machine Learning Toolbox)