複数の初期条件をもつ ODE 系の求解
この例では、複数の初期条件のセットをもつ連立常微分方程式を解くための 2 つの手法を比較します。手法は次のとおりです。
forループを使用して、初期条件のセットごとに 1 回、複数回のシミュレーションを実行する。この手法は簡単に使用できますが、大規模な連立方程式に対しては最良のパフォーマンスが得られません。ODE 関数をベクトル化して、初期条件のすべてのセットについて連立方程式を同時に解く。この手法は大規模な連立方程式に対してはより速い方法となりますが、入力を適切な形状に変更するよう ODE 関数を書き換える必要があります。
これらの手法の例示には、よく知られた Lotka-Volterra の方程式を使用します。これは、捕食者と被捕食者の個体群を記述する 1 次の非線形微分方程式です。
問題の説明
Lotka-Volterra の方程式は、生体系における捕食者と被捕食者の個体群を記述する、2 つの非線形 1 次 ODE 系です。方程式によると、捕食者と被捕食者の個体群は時間の経過とともに変化します。
これらの方程式の変数は次のとおりです。
は被捕食者の個体群のサイズ
は捕食者の個体群のサイズ
は時間
、、、および は 2 つの生物種間の相互作用を表す定数パラメーター。この例では、パラメーター値 、、および を使用します。
この問題では、 と の初期値は個体群の初期サイズです。方程式を解くことで、生物種が関わり合う中で、時間の経過とともに個体群がどのように変化するかについての情報が得られます。
1 つの初期条件での方程式の求解
MATLAB® で Lotka-Volterra の方程式を解くには、方程式をエンコードする関数を記述し、積分の時間区間を指定し、初期条件を指定します。次に、ode45 など ODE ソルバーのいずれかを使用して、連立方程式を時間とともにシミュレートすることができます。
方程式をエンコードする関数は次のとおりです。
function dpdt = lotkaODE(t,p)
% LOTKA Lotka-Volterra predator-prey model
delta = 0.02;
beta = 0.01;

dpdt = [p(1) .* (1 - beta*p(2));
        p(2) .* (-1 + delta*p(1))];
end
(この関数は、ローカル関数として例の最後に記載されています。)
連立方程式には 2 つの方程式が存在するため、dpdt は各方程式について 1 つの要素をもつベクトルとなります。また、解ベクトル p には各解要素につき 1 つの要素があります。p(1) は元の方程式の を表し、p(2) は元の方程式の を表します。
次に、積分の時間区間を に指定し、 と の初期個体群サイズを 50 に設定します。
t0 = 0;
tfinal = 15;
p0 = [50; 50];
ode45 で、ODE 関数、時間範囲、初期条件を指定して連立方程式を解きます。結果の個体群を時間に対してプロットします。
[t,p] = ode45(@lotkaODE,[t0 tfinal],p0);
plot(t,p)
title('Predator/Prey Populations Over Time')
xlabel('t')
ylabel('Population')
legend('Prey','Predators')

解が周期性を示しているため、位相プロットで、解を互いに対してプロットします。
plot(p(:,1),p(:,2))
title('Phase Plot of Predator/Prey Populations')
xlabel('Prey')
ylabel('Predators')

結果のプロットには、指定された個体群の初期サイズに対する解が示されます。個体群のさまざまな初期サイズに対する方程式を解くには、p0 の値を変えてシミュレーションを再実行します。しかし、この方法では一度に 1 つの初期条件の方程式しか解くことができません。次の 2 つの節では、多くの異なる初期条件について求解する手法を説明します。
方法 1: for- ループを使った複数の初期条件での計算
複数の初期条件で ODE 系を解くための最も簡単な方法は、for ループを使うことです。この手法では、単一の初期条件の手法と同じ ODE 関数を使用しますが、for ループによって解法プロセスが自動化されます。
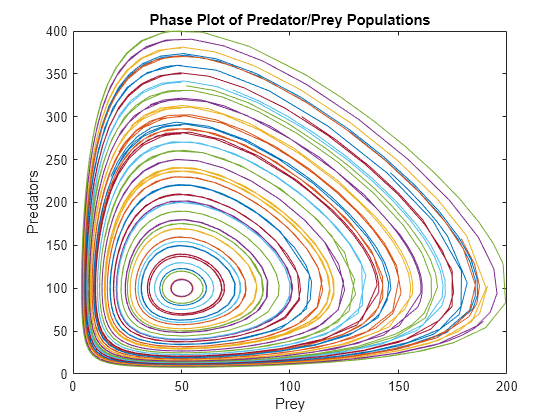
たとえば、 の個体群の初期サイズを 50 で一定に維持し、for ループを使用して、 の個体群の初期サイズを 10 から 400 の間で変化させることができます。y0 で個体群サイズのベクトルを作成し、値全体をループして、初期条件の各セットについて方程式を解きます。すべての反復からの結果を使って、位相プロットを作成します。
y0 = 10:10:400;
for k = 1:length(y0)
    [t,p] = ode45(@lotkaODE,[t0 tfinal],[50 y0(k)]);
    plot(p(:,1),p(:,2))
    hold on
end
title('Phase Plot of Predator/Prey Populations')
xlabel('Prey')
ylabel('Predators')
hold off

位相プロットには、異なる初期条件セットについて計算された解がすべて示されます。
方法 2: ベクトル化された ODE 関数を使った複数の初期条件での計算
複数の初期条件で ODE 系を解くもう 1 つの方法は、すべての方程式を同時に解くように ODE 関数を書き換えることです。その手順は以下のとおりです。
すべての初期条件を行列として
ode45に指定します。行列のサイズはs行n列となります。ここで、sは解要素の数、nは求解される初期条件の数です。このとき、行列の各列は、連立方程式の初期条件の 1 つの完全なセットを表します。ODE 関数は
n、すなわち初期条件の数に対応する追加の入力パラメーターを受け入れなければなりません。ODE 関数内で、ソルバーは解要素 p を列ベクトルとして渡します。ODE 関数は、ベクトルの形状をサイズが
s行 n 列の行列に変更しなければなりません。これで、行列の各行には各変数のすべての初期状態が含まれることになります。ODE 関数は、式が解要素のベクトルを受け入れるよう、ベクトル化された形式で方程式を解かなければなりません。つまり、
f(t,[y1 y2 y3 ...])は[f(t,y1) f(t,y2) f(t,y3) ...]を返さなければなりません。最後に、ODE ソルバーが各関数呼び出しからベクトルを受け取るよう、ODE 関数はその出力の形状をベクトルに戻さなければなりません。
これらの手順に従うことで、ODE 関数がベクトルの形状を行列に変更し、各解要素についてすべての初期条件で解くと同時に、ODE ソルバーは解要素のベクトルを使用して連立方程式を解くことができます。その結果、1 回のシミュレーションで、すべての初期条件に対し連立方程式を解くことができます。
この方法を Lotka-Volterra の連立方程式に対して実装するには、初期条件の数 n を特定することから始め、続いて初期条件の行列を作成します。
n = length(y0);
p0_all = [50*ones(n,1) y0(:)]';
次に、n を入力として受け入れるよう、ODE 関数を書き換えます。n を使用して解ベクトルの形状を行列に変更した後、ベクトル化された連立方程式を解き、出力の形状をベクトルに戻します。これらのタスクを実行するよう変更された ODE 関数は次のとおりです。
function dpdt = lotkasystem(t,p,n)
%LOTKA  Lotka-Volterra predator-prey model for system of inputs p.
delta = 0.02;
beta = 0.01;

% Change the size of p to be: Number of equations-by-number of initial
% conditions.
p = reshape(p,[],n);

% Write equations in vectorized form.
dpdt = [p(1,:) .* (1 - beta*p(2,:));
        p(2,:) .* (-1 + delta*p(1,:))];

% Linearize output.
dpdt = dpdt(:);
end
ode45 を使用して、すべての初期条件で連立方程式を解きます。ode45 では ODE 関数が 2 つの入力を受け入れるよう求められるため、無名関数を使用して、n の値をワークスペースから lotkasystem に渡します。
[t,p] = ode45(@(t,p) lotkasystem(t,p,n),[t0 tfinal],p0_all);
出力ベクトルの形状をサイズが (numTimeSteps*s) 行 n 列の行列に変更します。出力 p(:,k) の各列には初期条件の 1 つのセットに対する解が含まれます。解要素の位相プロットを作成します。
p = reshape(p,[],n);
nt = length(t);
for k = 1:n
    plot(p(1:nt,k),p(nt+1:end,k))
    hold on
end
title('Predator/Prey Populations Over Time')
xlabel('t')
ylabel('Population')
hold off

結果は for ループの手法で得られたものと同等です。ただし、ベクトル化による解法では、注意すべきいくつかの特徴があります。
計算された解は、単一の初期入力から計算された解とは微妙に異なる場合があります。この差が生じるのは、タイム ステップのサイズを計算するために ODE ソルバーが連立方程式全体に対しノルム チェックを適用し、その結果求解でのタイム ステップの動作がわずかに異なってくるためです。一般に、タイム ステップを変更しても解の精度には影響せず、どのタイミングで解が評価されるかに影響があります。
連立方程式の数値ヤコビアンを自動的に評価するスティッフな ODE ソルバー (
ode15s、ode23s、ode23t、ode23tb) では、ブロック対角型のヤコビアンのスパース パターンをodesetのJPatternオプションを使用して指定すると、計算の効率性が改善されることがあります。ブロック対角型のヤコビアンは、書き換えられた ODE 関数において入力の形状変更を実行することで得られます。
時間測定結果の比較
timeit を使用して、前述の各方法の時間を測定します。各方法との差を示すために、ベースラインとなる数値として、1 つの初期条件セットで方程式を解いた場合の時間測定が含められています。
% Time one IC
baseline = timeit(@() ode45(@lotkaODE,[t0 tfinal],p0),2);

% Time for-loop
for k = 1:length(y0)
    loop_timing(k) = timeit(@() ode45(@lotkaODE,[t0 tfinal],[50 y0(k)]),2);
end
loop_timing = sum(loop_timing);

% Time vectorized fcn
vectorized_timing = timeit(@() ode45(@(t,p) lotkasystem(t,p,n),[t0 tfinal],p0_all),2);
時間測定の結果を使って table を作成します。すべての結果を 1e3 で乗算し、時間をミリ秒単位で表現します。解ごとの時間の列を含めます。これは、各時間を求解対象の初期条件の数で割ったものです。
TimingTable = table(1e3.*[baseline; loop_timing; vectorized_timing], ...
    1e3.*[baseline; loop_timing/n; vectorized_timing/n],...
    'VariableNames',{'TotalTime (ms)','TimePerSolution (ms)'},'RowNames', ...
    {'One IC','Multi ICs: For-loop', 'Mult ICs: Vectorized'})
TimingTable=3×2 table
                            TotalTime (ms)    TimePerSolution (ms)
                            ______________    ____________________

    One IC                     0.18549               0.18549
    Multi ICs: For-loop         7.2253               0.18063
    Mult ICs: Vectorized       0.63076              0.015769
TimePerSolution 列は、ベクトル化による手法が 3 つの方法の中で最も高速であることを示しています。
ローカル関数
ここでは、ode45 が解を計算するために呼び出すローカル関数を紹介しています。
function dpdt = lotkaODE(t,p)
% LOTKA Lotka-Volterra predator-prey model
delta = 0.02;
beta = 0.01;

dpdt = [p(1) .* (1 - beta*p(2));
        p(2) .* (-1 + delta*p(1))];
end
%------------------------------------------------------------------
function dpdt = lotkasystem(t,p,n)
%LOTKA  Lotka-Volterra predator-prey model for system of inputs p.
delta = 0.02;
beta = 0.01;

% Change the size of p to be: Number of equations-by-number of initial
% conditions.
p = reshape(p,[],n);

% Write equations in vectorized form.
dpdt = [p(1,:) .* (1 - beta*p(2,:));
        p(2,:) .* (-1 + delta*p(1,:))];

% Linearize output.
dpdt = dpdt(:);
end