米国の人口を予測
この例では、多項式を使用したデータの外挿は、適度であっても、危険で信頼性が低いことを示します。
この例の予測は、MATLAB® が作成されるより前に行われたものです。1977 年に Prentice-Hall によって公表され、Forsythe、Malcolm、および Moler らの Computer Methods for Mathematical Computations 内の演習として始まりました。
現在では、MATLAB によって、パラメーターを変更して結果を見ることは大変容易に行えますが、根本的な数学的法則は変わりません。
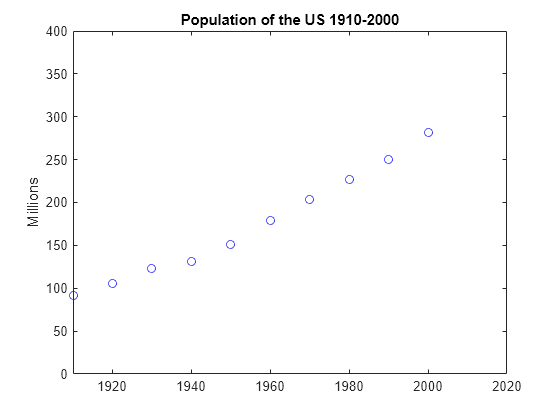
1910 年から 2000 年の米国の人口調査データを使用して 2 つのベクトルを作成してプロットします。
% Time interval
t = (1910:10:2000)';

% Population
p = [91.972 105.711 123.203 131.669 150.697...
    179.323 203.212 226.505 249.633 281.422]';

% Plot
plot(t,p,'bo');
axis([1910 2020 0 400]);
title('Population of the US 1910-2000');
ylabel('Millions');
2010 年には人口はどうなると推定しますか?
p
p = 10×1

   91.9720
  105.7110
  123.2030
  131.6690
  150.6970
  179.3230
  203.2120
  226.5050
  249.6330
  281.4220
t の多項式でデータに当てはめ、これを使用して t = 2010 に人口値を外挿します。多項式の係数を取得するため、要素がスケーリングした時間 A(i,j) = s(i)^(n-j) の乗数として 11 行 11 列のヴァンデルモンド行列をもつ線形連立方程式を解きます。
n = length(t);
s = (t-1950)/50;
A = zeros(n);
A(:,end) = 1;
for j = n-1:-1:1
   A(:,j) = s .* A(:,j+1);
end
データ p に当てはめる次数 d の多項式である係数 c を取得するために、ヴァンデルモンド行列の最後の d+1 列を含む線形連立方程式を解きます。
A(:,n-d:n)*c ~= p
d < 10の場合、未知数より方程式の数が多くなり、最小二乗解は適切です。d == 10の場合、その方程式の厳密な解を求めることができ、多項式は実際にデータを内挿します。
どちらの場合も、バックスラッシュ演算子を使用して方程式を解きます。3 次の近似に対する係数は、次のとおりです。
c = A(:,n-3:n)\p
c = 4×1

   -5.7042
   27.9064
  103.1528
  155.1017
1910 年から 2010 年の各年で多項式を評価し、結果をプロットします。
v = (1910:2020)';
x = (v-1950)/50;
w = (2010-1950)/50;
y = polyval(c,x);
z = polyval(c,w);

hold on
plot(v,y,'k-');
plot(2010,z,'ks');
text(2010,z+15,num2str(z));
hold off

3 次と 4 次多項式近似を比較します。外挿の点が大きく異なることに注意してください。
c = A(:,n-4:n)\p;
y = polyval(c,x);
z = polyval(c,w);

hold on
plot(v,y,'k-');
plot(2010,z,'ks');
text(2010,z-15,num2str(z));
hold off

次数が増加すると、外挿はさらに不安定になります。
cla
plot(t,p,'bo')
hold on
axis([1910 2020 0 400])
colors = hsv(8);
labels = {'data'};
for d = 1:8
   [Q,R] = qr(A(:,n-d:n));
   R = R(1:d+1,:);
   Q = Q(:,1:d+1);
   c = R\(Q'*p);    % Same as c = A(:,n-d:n)\p;
   y = polyval(c,x);
   z = polyval(c,w);
   plot(v,y,'color',colors(d,:));
   plot(2010,z,'s','color',colors(d,:));
   labels{end+1} = ['degree = ' int2str(d)];
   labels{end+1} = '';
end
legend(labels, 'Location', 'NorthWest')
hold off
