グラフィックス オブジェクトの変更
MATLAB® チャートはグラフィックス オブジェクトの階層で構成されます。標準的なライン プロットは、Root オブジェクト (groot)、それに続く Figure オブジェクト、Axes オブジェクト、最後の Line オブジェクトで構成されます。階層内のオブジェクトにアクセスし、そのプロパティを表示し、プロパティを設定して外観を変更できます。
グラフィックス オブジェクトのより包括的な図については、グラフィックス オブジェクトを参照してください。
オブジェクトへのアクセス
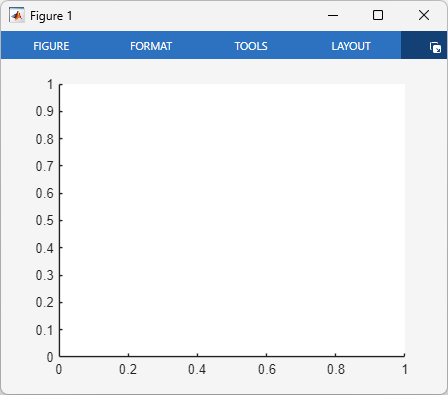
グラフィックス オブジェクトにアクセスする 1 つの方法は、オブジェクトを作成するときに、オブジェクトを出力引数として返すことです。たとえば、Figure オブジェクト f と子の Axes オブジェクト ax を作成します。
f = figure;
ax = axes(f);
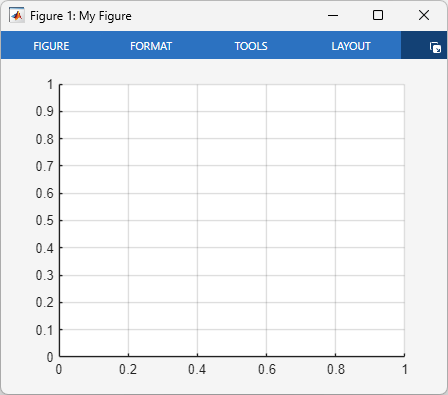
f と ax を使用して、Figure オブジェクトおよび Axes オブジェクトのプロパティを設定します。たとえば、Figure オブジェクトの Name プロパティを設定し、Axes オブジェクトの XGrid プロパティと YGrid プロパティを "on" に設定します。
f.Name = "My Figure";
ax.XGrid = "on";
ax.YGrid = "on";
別のグラフィックス オブジェクトにアクセスするもう 1 つの方法は、gcf 関数を使用して現在の Figure を取得するか、gca 関数を使用して現在の座標軸を取得することです。現在の Figure は通常、最後に作成、クリック、または変更した Figure です。Figure が存在しないときに gcf を呼び出すと、MATLAB は Figure オブジェクトを作成し、それを現在の Figure にします。同様に、現在の Figure が空の場合に gca を呼び出すと、現在の Figure に新しい Axes オブジェクトが作成されます。Figure が存在しない場合、gca は Figure オブジェクトを作成し、その中に Axes オブジェクトを配置します。
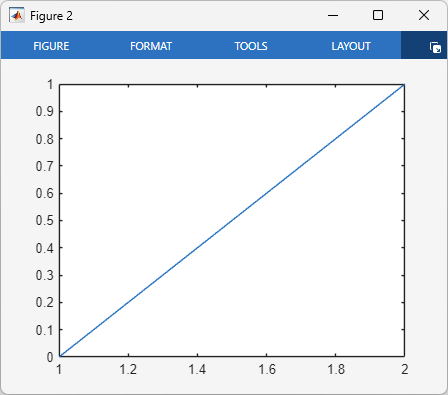
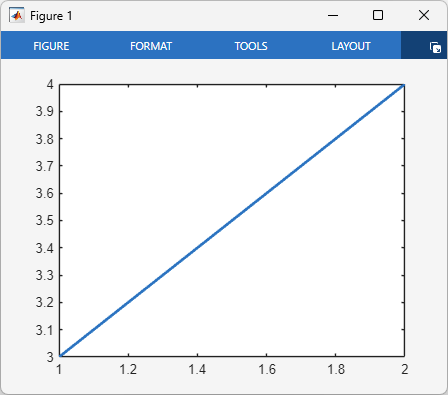
現在の Figure または Axes オブジェクトにアクセスできる場合は、Parent プロパティおよび Children プロパティを使用して、階層の異なるレベルにあるオブジェクトにアクセスできます。たとえば、新しい Figure を作成し、その中にラインをプロットします。この場合、Figure は最初は空なので、plot 関数は Axes オブジェクトと Line オブジェクトを両方とも作成します。
figure
plot([0 1])
gca 関数を使用して現在の座標軸を取得し、変数 ax に保存します。ax の Parent プロパティおよび Children プロパティを使用して、Figure オブジェクトおよび Line オブジェクトを取得します。
ax = gca;
f = ax.Parent;
p = ax.Children;
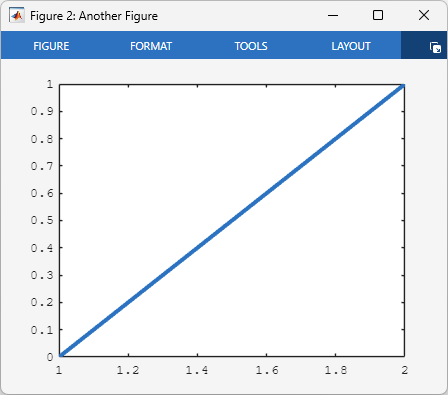
プロパティを設定して、Figure の名前、座標軸のフォント、ライン幅を変更します。
f.Name = "Another Figure";
ax.FontName = "courier";
p.LineWidth = 3;
オブジェクトに複数の子が含まれている場合、配列インデックスを使用して、変更する 1 つ以上の子オブジェクトを選択できます。インデックス値は作成の逆順で割り当てられます。
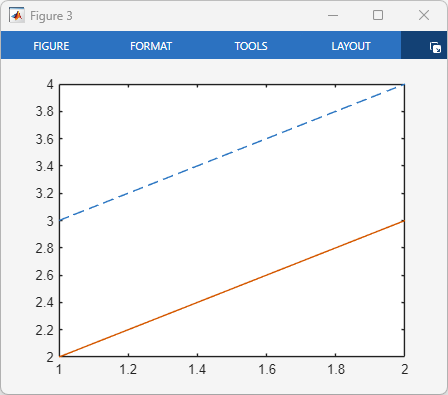
たとえば、2 本のラインをプロットし、最初に作成したライン (Children プロパティの最後の配列要素) に破線のライン スタイルを割り当てます。
figure
plot([3 4])
hold on
plot([2 3])
hold off
ax = gca;
firstLine = ax.Children(end);
firstLine.LineStyle = "--";
プロパティのリストの表示
オブジェクトのプロパティのリストを表示するには、get 関数を使用します。たとえば、Figure を作成し、そのプロパティとその値をリストします。
f = figure;
get(f)
Alphamap: [0 0.0159 0.0317 0.0476 0.0635 ...]
AutoResizeChildren: off
BeingDeleted: off
BusyAction: 'queue'
ButtonDownFcn: ''
Children: [0×0 GraphicsPlaceholder]
Clipping: on
CloseRequestFcn: 'closereq'
Color: [0.9608 0.9608 0.9608]
Colormap: [256×3 double]
ContextMenu: [0×0 GraphicsPlaceholder]
CreateFcn: ''
CurrentAxes: [0×0 GraphicsPlaceholder]
CurrentCharacter: ''
CurrentObject: [0×0 GraphicsPlaceholder]
CurrentPoint: [0 0]
DeleteFcn: ''
DockControls: on
FileName: ''
GraphicsSmoothing: on
HandleVisibility: 'on'
Icon: ''
InnerPosition: [363 278 1194 719]
IntegerHandle: on
Interruptible: on
InvertHardcopy: on
KeyPressFcn: ''
KeyReleaseFcn: ''
MenuBar: 'none'
Name: ''
NextPlot: 'add'
Number: 1
NumberTitle: on
OuterPosition: [363 278 1194 719]
PaperOrientation: 'portrait'
PaperPosition: [-1.9688 1.7552 12.4375 7.4896]
PaperPositionMode: 'auto'
PaperSize: [8.5000 11]
PaperType: 'usletter'
PaperUnits: 'inches'
Parent: [1×1 Root]
Pointer: 'arrow'
PointerShapeCData: [16×16 double]
PointerShapeHotSpot: [1 1]
Position: [363 278 1194 719]
Renderer: 'opengl'
RendererMode: 'auto'
Resize: on
Scrollable: off
SelectionType: 'normal'
SizeChangedFcn: ''
Tag: ''
Theme: [1×1 matlab.graphics.theme.GraphicsTheme]
ThemeChangedFcn: ''
ThemeMode: 'auto'
ToolBar: 'auto'
Type: 'figure'
Units: 'pixels'
UserData: []
Visible: on
WindowButtonDownFcn: ''
WindowButtonMotionFcn: ''
WindowButtonUpFcn: ''
WindowKeyPressFcn: ''
WindowKeyReleaseFcn: ''
WindowScrollWheelFcn: ''
WindowState: 'normal'
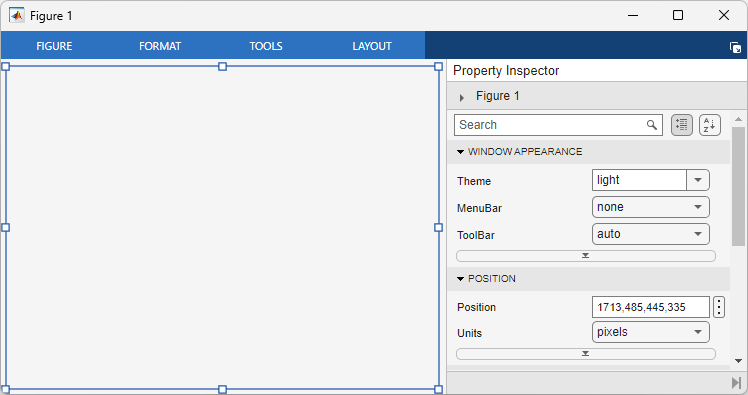
WindowStyle: 'docked'inspect 関数を使用して、対話型のプロパティ インスペクターでプロパティを表示することもできます。
inspect(f)
すべてのグラフィックス オブジェクトのプロパティの詳細な説明については、グラフィックス オブジェクトのプロパティを参照してください。
プロパティの設定
グラフィックス オブジェクトのプロパティを設定する方法はいくつかあります。自分にとって最も便利な方法を選択してください。
ドット表記の使用
これまでの例で示したように、既存のオブジェクトにアクセスできる場合は、ドット表記を使用できます。ドット表記では、オブジェクト変数名の後にピリオドとプロパティ名を指定します。たとえば、次のコードはラインをプロットし、ライン幅を 2 に設定します。
figure
p = plot([3 4]);
p.LineWidth = 2;
名前と値の引数の使用
プロット関数を呼び出す際に名前と値の引数を指定してプロパティを設定することもできます。名前と値の引数を指定するには、プロパティ名の後に等号とプロパティ値を続けます。他のすべての引数の後に、1 つ以上の名前と値の引数を指定します。
たとえば、ラインをプロットするときに、LineStyle プロパティと LineWidth プロパティを設定します。
figure
plot([3 4],LineStyle="--",LineWidth=2)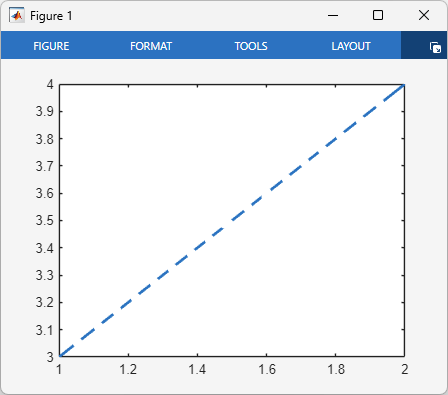
メモ
Axes オブジェクトを作成するときに名前と値の引数を指定することもできます。ただし、ほとんどのプロット関数は座標軸のプロパティをリセットします。最良の結果を得るには、プロット後に座標軸のプロパティを設定します。
set 関数の使用
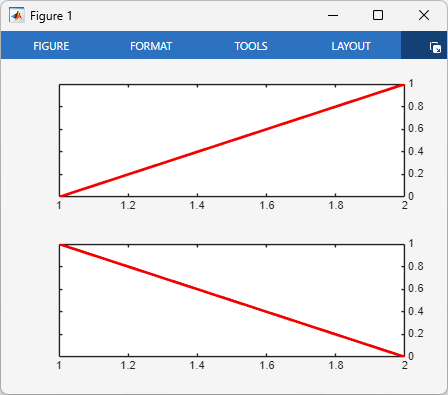
複数のオブジェクトのプロパティを一度に設定するには、set 関数を使用します。たとえば、タイル表示チャート レイアウトで 2 本のラインをプロットします。両方ともライン幅が 2 で色が赤になるようにラインを変更します。次に、両方の y 軸の位置を右側に設定します。
figure
ax1 = nexttile;
p1 = plot([0 1]);
ax2 = nexttile;
p2 = plot([1 0]);

% Set the width and color of both lines
set([p1 p2],LineWidth=2,Color="red")

% Display the y-axes on the right side
set([ax1 ax2],YAxisLocation="right")
特定のプロパティを制御する関数の使用
プロパティを直接設定する代わりに、関数を使用して特定のプロパティを設定することもできます。
たとえば、ラインをプロットしてから座標軸のグリッド ラインを表示し、フォントを変更し、x 軸と y 軸の範囲を調整します。grid 関数は、Axes オブジェクトの XGrid プロパティと YGrid プロパティを変更します。fontname 関数は、Axes オブジェクトの FontName プロパティを変更します。xlim 関数および ylim 関数は、Axes オブジェクトの XLim プロパティと YLim プロパティを変更します。
figure
plot([0 4 2 6 4 8],Marker="o")
grid on
fontname("courier")
xlim([0 7])
ylim([-1 9])
![Figure containing an axes object that displays grid lines and contains a line plot with x-axis limits of [0, 7] and y-axis limits of [–1, 9]. The tick labels use the Courier font.](modify-gobjects-axeslims.png)
Axes プロパティを設定する関数のリストについては、座標軸の外観を参照してください。