グラフィックス配列
R2026b複数のグラフィックス オブジェクトをグラフィックス配列に格納して管理します。この方法により、特に複数のオブジェクトを一度に変更する場合に、プロパティの変更を簡単に行えます。プロット関数からグラフィックス配列を取得することも、独自のグラフィックス オブジェクトのコレクションを作成することも可能です。グラフィックス配列を使用する場合、配列インデックス付けを使用してそこに格納されたオブジェクトにアクセスしたり、特定のタスクをベクトル化したり、パフォーマンス向上のために配列を事前に割り当てたりすることができます。
プロット関数によって作成された配列へのアクセス
複数のオブジェクトをまとめてプロットすると、プロット関数は作成したオブジェクトを含むグラフィックス配列を返します。たとえば、plot 関数を使用して 3 つのラインをプロットし、出力引数を 1 つ指定して Line オブジェクトを返します。次に、凡例を追加します。
y = [10 0 7; 0 10 7; 10 0 7];
p = plot(y,LineWidth=3);
legend(["Line 1", "Line 2", "Line 3"])
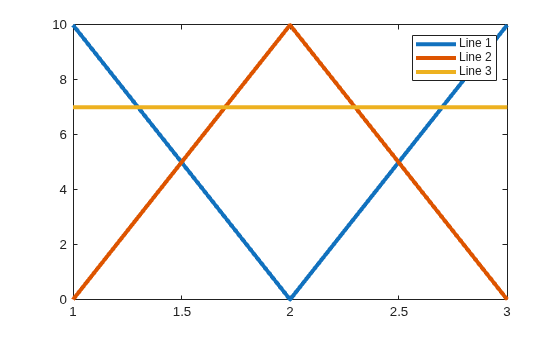
Line オブジェクトの列ベクトルである p の要素を表示します。p の要素の 1 つにアクセスするには、任意の列ベクトルにインデックス付けする場合と同じように配列インデックスを使用します。インデックス値は最上部の 1 から始まり、列の下にある要素ほど大きくなります。
p
p =
  3×1 Line array:

  Line    (Line 1)
  Line    (Line 2)
  Line    (Line 3)
Line 2 の色をマゼンタに変更します。
p(2).Color = "magenta";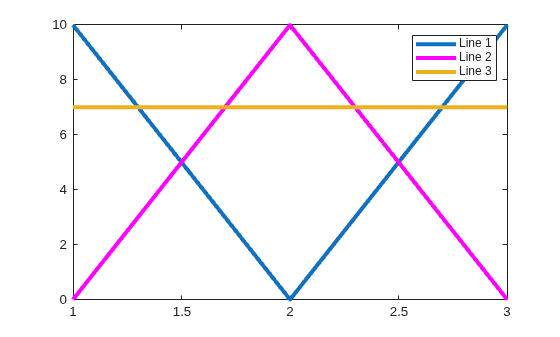
Figure、Axes、TiledChartLayout オブジェクトには、それぞれ子オブジェクトをグラフィックス配列として格納する Children プロパティがあります。このプロパティを使用すると、変数として明示的に格納されていないオブジェクトにアクセスできます。
たとえば、プロット内の Line オブジェクトにアクセスするには、Axes オブジェクトの Children プロパティを使用します。plot 関数によって返される列ベクトルとは異なり、Axes オブジェクトの子は、プロット内のスタック順に従ってリストされます。スタックの最上位にあるオブジェクトは、Children プロパティに格納されている列ベクトルの最初の要素です。
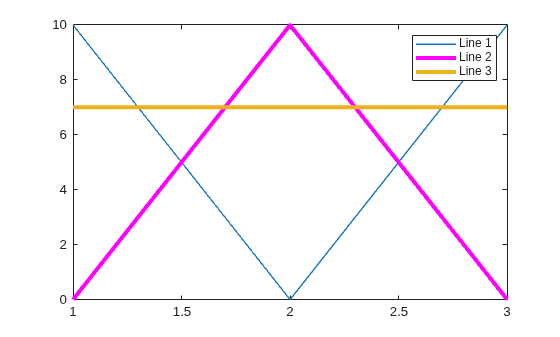
先ほどのプロットでは、Line 1 はスタックの最下部 (プロット内の他のラインの後ろ) にあります。gca 関数を使用して現在の座標軸を取得します。次に、Axes オブジェクトの Children プロパティを表示します。Line 1 はベクトル内の 3 番目の要素であるため、インデックス値は 3 です。
ax = gca;
ax.Children
ans =
  3×1 Line array:

  Line    (Line 3)
  Line    (Line 2)
  Line    (Line 1)
Line 1 の太さを小さくします。
ax.Children(3).LineWidth = 1;
場合によっては、子オブジェクトのインデックス値が明確でないことがあります。プロパティ値をクエリしてターゲット オブジェクトを見つけることができます。たとえば、タイル表示チャート レイアウトで 4 つのプロットを作成します。
figure
t = tiledlayout;
for k = 1:4
    nexttile
    plot(1:k*10)
end
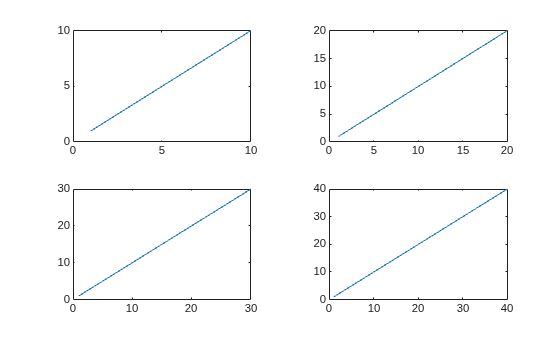
TiledChartLayout オブジェクトの Children プロパティには 4 つの Axes オブジェクトがありますが、リストからはどの Axes オブジェクトが各プロットに対応しているのかが示されません。
t.Children
ans =
  4×1 Axes array:

  Axes
  Axes
  Axes
  Axes
各 Axes オブジェクトは異なる x 軸の範囲をもつため、XLim プロパティをクエリして識別できます。結果は Children プロパティの要素と同じ順序でリストされます。(あるいは、nexttile 関数を使用して、タイル表示チャート レイアウト内の Axes オブジェクトを特定できます。)
t.Children.XLim
ans = 1×2

     0    40
ans = 1×2

     0    30
ans = 1×2

     0    20
ans = 1×2

     0    10
グラフィックス配列の作成
数値配列を作成する場合と同様に、要素を大かっこ内に指定することでグラフィックス配列を作成できます。たとえば、タイル表示チャート レイアウト内に 6 つの Axes オブジェクトを作成します。
figure
tiledlayout
ax1 = nexttile;
ax2 = nexttile;
ax3 = nexttile;
ax4 = nexttile;
ax5 = nexttile;
ax6 = nexttile;
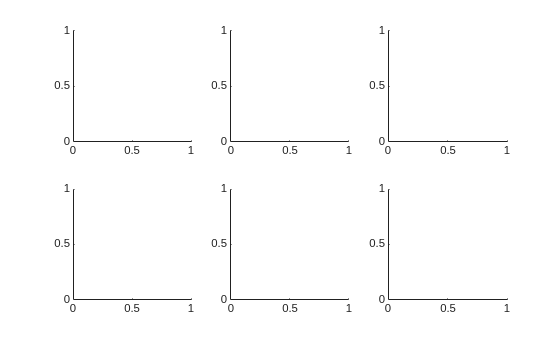
1 行 6 列のグラフィックス配列 garr に Axes オブジェクトを格納します。配列内の要素は、スペースまたはコンマで区切ることができます。結果として得られる配列 garr のデータ型は Axes です。
garr = [ax1 ax2 ax3 ax4 ax5 ax6]
garr =
  1×6 Axes array:

    Axes    Axes    Axes    Axes    Axes    Axes
行の間にセミコロンを使用して 2 次元配列を作成します。各次元内では、行および列の要素数が一致している必要があります。たとえば、Axes オブジェクトの 2 行 3 列の配列を作成します。
garr2 = [ax1 ax2 ax3; ax4 ax5 ax6]
garr2 =
  2×3 Axes array:

    Axes    Axes    Axes
    Axes    Axes    Axes
それぞれ異なるタイプのグラフィックス オブジェクトを含む異種混合配列を作成することもできます。たとえば、現在の Figure (gcf) と ax1 を含む配列 hetarr を作成します。結果として得られる配列 hetarr のデータ型は graphics です。
hetarr = [gcf ax1]
hetarr =
  1×2 graphics array:

    Figure    Axes
一部の関数は入力としてグラフィックス配列を受け入れるため、複数のオブジェクトを同時に変更できます。たとえば、garr2 を grid 関数に渡して、すべての座標軸にグリッドを同時に表示します。
grid(garr2,"on")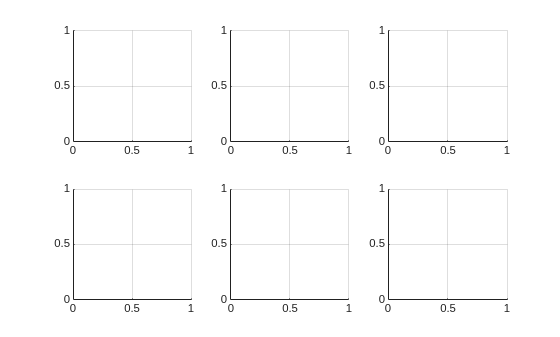
2 番目の Axes オブジェクトにマイナー グリッドを表示します。配列インデックスとドット表記を使用して、garr2 の 1 行 2 列目にある Axes オブジェクトの XMinorGrid プロパティおよび YMinorGrid プロパティにアクセスします。
garr2(1,2).XMinorGrid = "on";
garr2(1,2).YMinorGrid = "on";
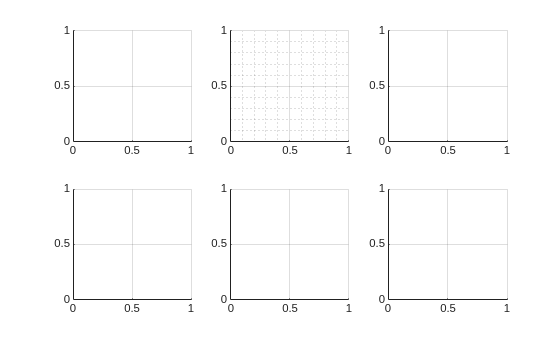
set の操作をベクトル化することもできます。たとえば、各 Axes オブジェクトの GridAlpha プロパティを 1 に設定して、すべてのメジャー グリッド ラインを不透明にします。
set(garr2,GridAlpha=1)
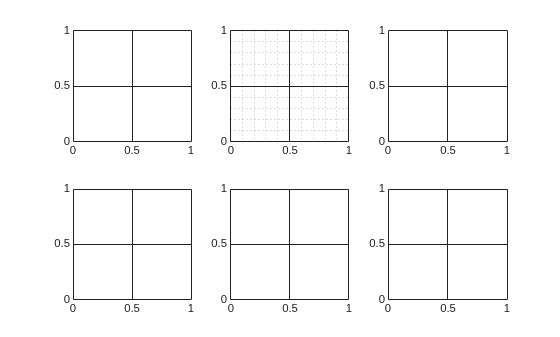
グラフィックス配列の事前割り当て
グラフィックス配列を事前に割り当てるには、gobjects 関数を使用します。その後、グラフィックス オブジェクトを作成する際に、配列の要素を設定できます。
ループ内でオブジェクトを作成する場合、事前割り当てした配列の要素を設定する方が、元々空の配列の末尾に新しい要素を追加するよりも効率的です。
たとえば、5 行 5 列のグラフィックス配列 ax をあらかじめ割り当てます。nexttile 関数を呼び出してタイル チャート表示レイアウト内に 25 個の Axes オブジェクトを作成し、その Axes オブジェクトを ax 内の特定の位置に返す for ループを記述します。次に、ランダム データをプロットします。
figure
ax = gobjects(5,5);
t = tiledlayout(5,5,TileSpacing="compact");
for i = 1:25
   ax(i) = nexttile;
   scatter(1:10,rand(1,10),".")
   ylim([0 1])
end
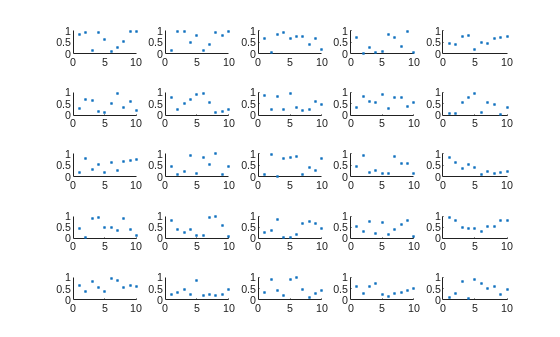
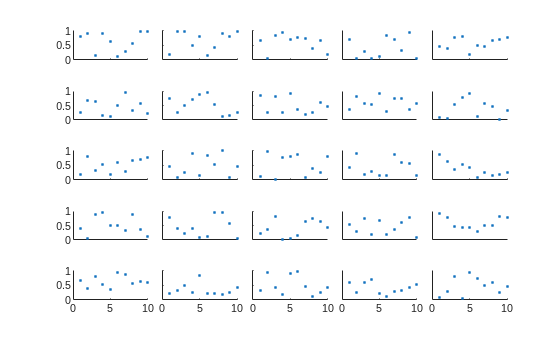
左側の列と最下行にあるものを除き、すべての Axes オブジェクトから目盛りラベルを削除します。
xticklabels(ax(1:20),[])
idx = [2:5; 7:10; 12:15; 17:20; 22:25];
yticklabels(ax(idx),[])
参考
関数
tiledlayout|nexttile|gobjects|grid|xticklabels|yticklabels

