二変量ヒストグラムによるカラー解析
この例では、二変量ヒストグラム プロットのカラー スケールを調整し、ビンについてより詳細な情報を表示する方法を説明します。
イメージ peppers.png を読み込みます。これは複数種類の唐辛子とその他の野菜のカラー写真です。符号なし 8 ビット整数配列 rgb にイメージ データが含まれています。
rgb = imread('peppers.png');
imshow(rgb)
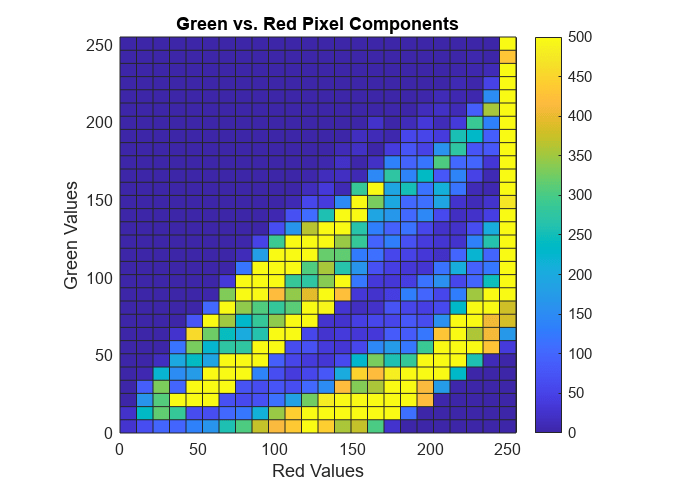
各ピクセルについて赤と緑の RGB 値の二変量ヒストグラムをプロットし、色の分布を可視化します。
r = rgb(:,:,1);
g = rgb(:,:,2);
b = rgb(:,:,3);
histogram2(r,g,'DisplayStyle','tile','ShowEmptyBins','on', ...
    'XBinLimits',[0 255],'YBinLimits',[0 255]);
axis equal
colorbar
xlabel('Red Values')
ylabel('Green Values')
title('Green vs. Red Pixel Components')

カウント数が非常に大きいビンがいくつかあるため、ヒストグラムがカラー スケールの下部に大きく偏っています。このため、ほとんどのビンがカラーマップの最初の色である青色で表示されています。詳細表示なしに、どの色が優勢であるかを結論付けることは困難です。
詳細を表示するために、座標軸の CLim プロパティを 0 ~ 500 の範囲に設定し、ヒストグラムのカラー スケールを再スケーリングします。この結果、カウント数が 500 以上のヒストグラム ビンは、カラーマップの最後の色である黄色で表示されます。ほとんどのビンのカウント数は、この狭い範囲内にあるため、表示されるビンの色の種類がより多くなります。
ax = gca;
ax.CLim = [0 500];
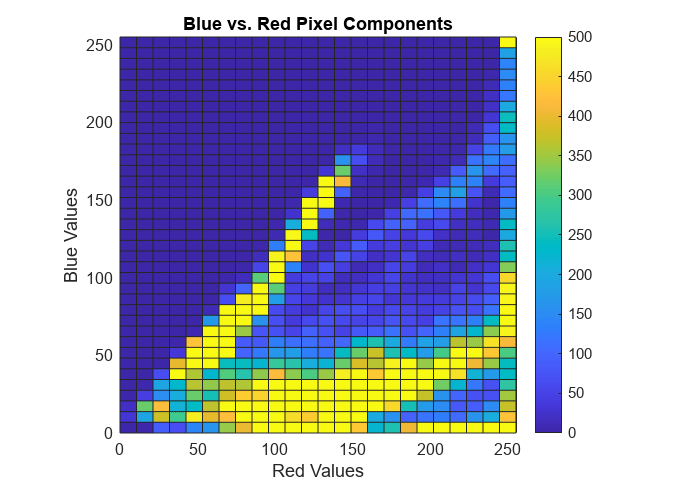
赤と青、および緑と青の優勢を比較する場合も、同様の方法を使用します。
histogram2(r,b,'DisplayStyle','tile','ShowEmptyBins','on',...
    'XBinLimits',[0 255],'YBinLimits',[0 255]);
axis equal
colorbar
xlabel('Red Values')
ylabel('Blue Values')
title('Blue vs. Red Pixel Components')
ax = gca;
ax.CLim = [0 500];
histogram2(g,b,'DisplayStyle','tile','ShowEmptyBins','on',...
    'XBinLimits',[0 255],'YBinLimits',[0 255]);
axis equal
colorbar
xlabel('Green Values')
ylabel('Blue Values')
title('Green vs. Blue Pixel Components')
ax = gca;
ax.CLim = [0 500];
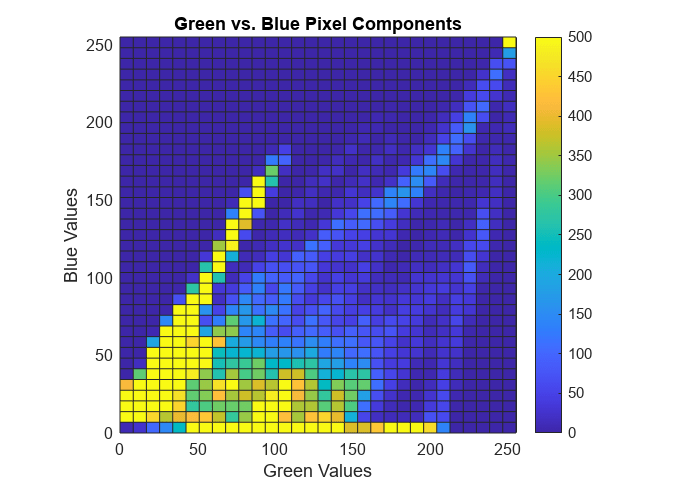
いずれの場合も、青は最も優勢度が低いカラー信号です。3 つのヒストグラムをすべて確認すると、赤が優勢な色であることがわかります。
RGB 色空間でカラー ヒストグラムを作成することにより、結果を確認してください。3 つのすべての色成分において、比較的小さな RGB 値でスパイクが発生しています。ただし、100 を超える値では赤の成分が他よりも高い頻度で出現しています。
histogram(r,'BinMethod','integers','FaceColor','r','EdgeAlpha',0,'FaceAlpha',1)
hold on
histogram(g,'BinMethod','integers','FaceColor','g','EdgeAlpha',0,'FaceAlpha',0.7)
histogram(b,'BinMethod','integers','FaceColor','b','EdgeAlpha',0,'FaceAlpha',0.7)
xlabel('RGB value')
ylabel('Frequency')
title('Color histogram in RGB color space')
xlim([0 257])
