Annotate a Web Map with Measurement Information
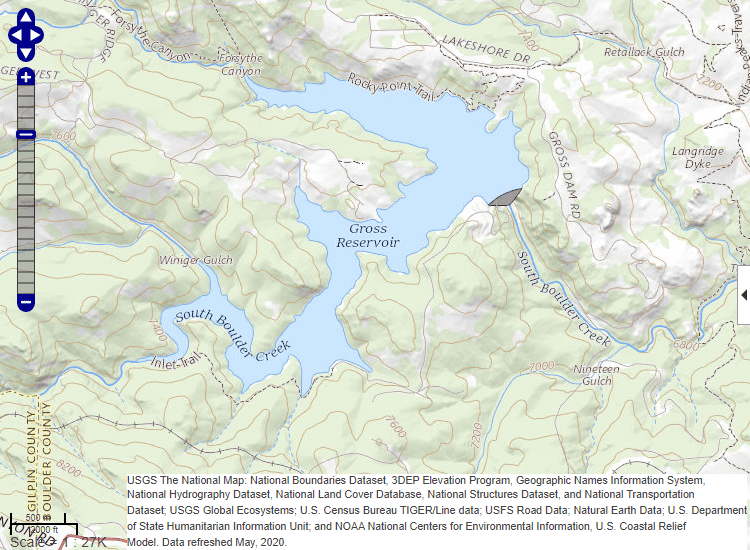
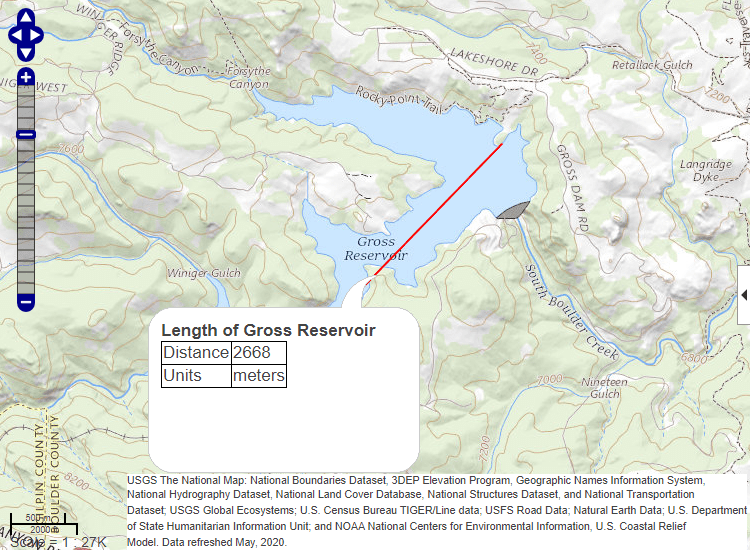
This example shows how to use a map to get information about a geographic feature. To illustrate, this example measures the length of the Gross Reservoir and adds some markers and a line overlay that act as annotations on the map.
Open a web map centered on the Gross Reservoir west of Boulder, Colorado. Use the USGS Shaded Topographic Map to get the level of topographical detail required for this measurement.
webmap('usgsshadedtopographicmap')
lat = 39.9428;
lon = -105.3691;
zoom = 14;
wmcenter(lat,lon,zoom)

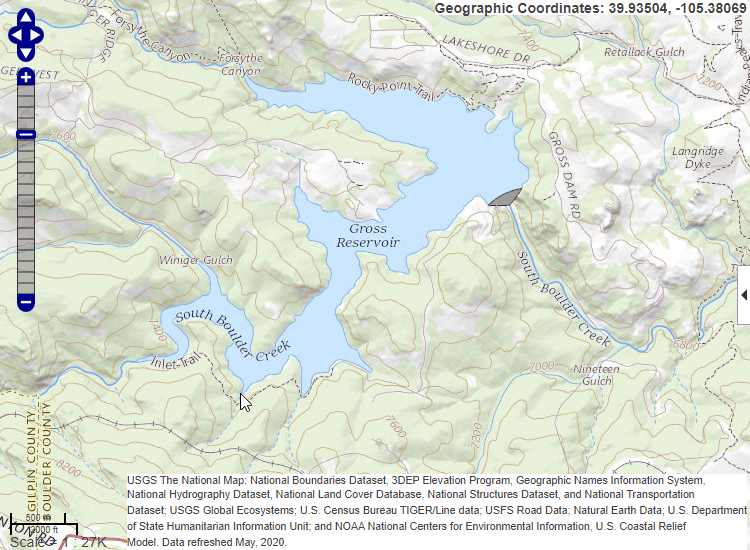
Identify two points at opposite ends of the lake and get the latitude and longitude of these points. To get this information in a web map, move the mouse pointer over a location on the map. In the upper right corner, the window displays the geographic coordinates of the point.

Store the latitude and longitude information in a geoshape vector.
lat1 = 39.93504;
lon1 = -105.38069;
lat2 = 39.95226;
lon2 = -105.35892;
s = geoshape([lat1 lat2],[lon1 lon2])
s =

 1×1 geoshape vector with properties:

 Collection properties:
     Geometry: 'line'
     Metadata: [1×1 struct]
 Vertex properties:
     Latitude: [39.9350 39.9523]
    Longitude: [-105.3807 -105.3589]
Calculate the distance between the two points to get the length of the
reservoir. Use the distance function which calculates the
distance between points on a sphere or ellipsoid.
d = distance(s.Latitude(1),s.Longitude(1),s.Latitude(2), ...
    s.Longitude(2),wgs84Ellipsoid)
d = 2.6678e+03
Display a line between the two points. Include information about the length of the lake in the line’s information balloon. Store the distance and information about units as two dynamic fields added to the geoshape vector.
s.Distance = round(d);
s.Units = 'meters';

wmline(s,'Color','red','FeatureName','Length of Gross Reservoir', ...
    'Overlayname','Transect');

See Also
webmap | wmsfind | wmsupdate | wmmarker | wmline | wmpolygon | wmremove | geoshape
