このページは機械翻訳を使用して翻訳されました。最新版の英語を参照するには、ここをクリックします。
3Dパレート フロントをプロットする
この例では、3 つの目的に対してパレート フロントをプロットする方法を示します。各目的関数は、特定の 3D の点からの距離の 2 乗です。計算速度を上げるために、各目的関数をドット積としてベクトル化した形式で記述します。密なソリューション セットを取得するには、パレート フロント上の 200 個の点を使用します。
この例では、まず組み込みの 'psplotparetof' プロット関数を使用してプロットを取得する方法を示します。次に、同じ問題を解き、gamultiobj を使用してプロットを取得します。これには、若干異なるオプション設定が必要です。この例では、パレート図内の特定の点の解の変数を取得する方法を示します。次に、例では、プロット関数を使用せずに点を直接プロットする方法と、パレート点の代わりに補間されたサーフェスをプロットする方法を示します。
fun = @(x)[dot(x - [1,2,3],x - [1,2,3],2), ...
    dot(x - [-1,3,-2],x - [-1,3,-2],2), ...
    dot(x - [0,-1,1],x - [0,-1,1],2)];
options = optimoptions('paretosearch','UseVectorized',true,'ParetoSetSize',200,...
    'PlotFcn','psplotparetof');
lb = -5*ones(1,3);
ub = -lb;
rng default % For reproducibility
[x,f] = paretosearch(fun,3,[],[],[],[],lb,ub,[],options);
Pareto set found that satisfies the constraints.

Optimization completed because the relative change in the volume of the Pareto set
is less than 'options.ParetoSetChangeTolerance' and constraints are satisfied to within
'options.ConstraintTolerance'.
opts = optimoptions('gamultiobj',"PlotFcn","gaplotpareto","PopulationSize",200);
[xg,fg] = gamultiobj(fun,3,[],[],[],[],lb,ub,[],opts);
gamultiobj stopped because the average change in the spread of Pareto solutions is less than options.FunctionTolerance.
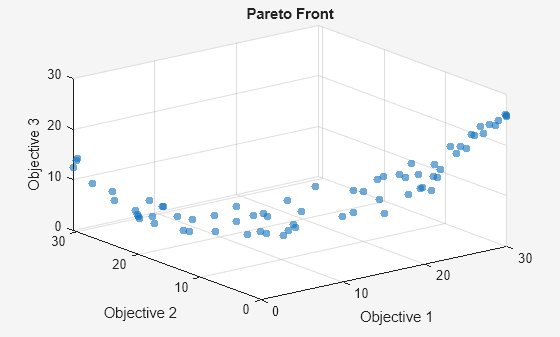
このプロットには、paretosearch プロットよりもはるかに少ない点が表示されます。より大きな母集団を使用して問題を再度解きます。
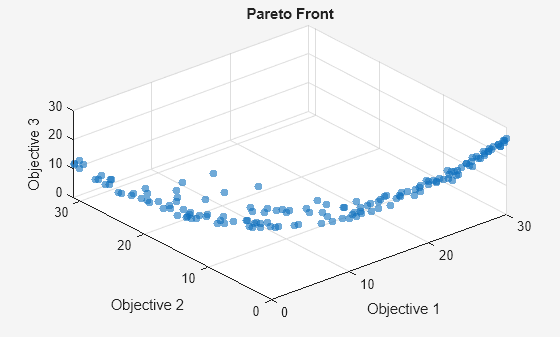
opts.PopulationSize = 400;
[xg,fg] = gamultiobj(fun,3,[],[],[],[],lb,ub,[],opts);
gamultiobj stopped because the average change in the spread of Pareto solutions is less than options.FunctionTolerance.
psplotpareto プロットに一致するように表示角度を変更します。
view(-40,57)
ツールヒントを使用して解の点を見つける
データ ヒント ツールを使用して、プロット内の点を選択します。

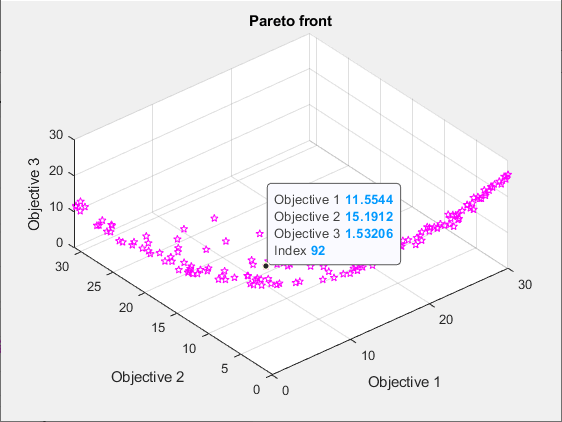
写真の点のインデックスは 92 です。示された点に関連付けられた解の変数を含む点 xg(92,:) を表示します。
disp(xg(92,:))
-0.2889 0.0939 0.4980
この時点で目的関数を評価して、表示された値と一致することを確認します。
disp(fun(xg(92,:)))
11.5544 15.1912 1.5321
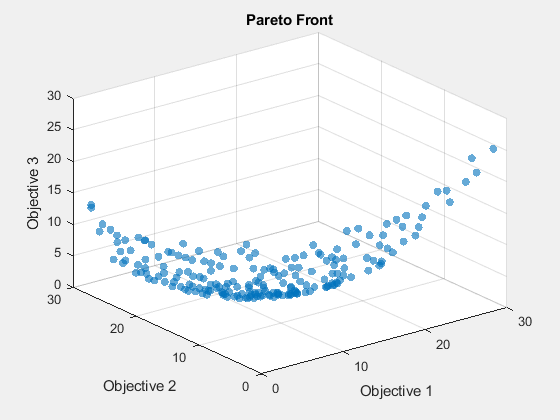
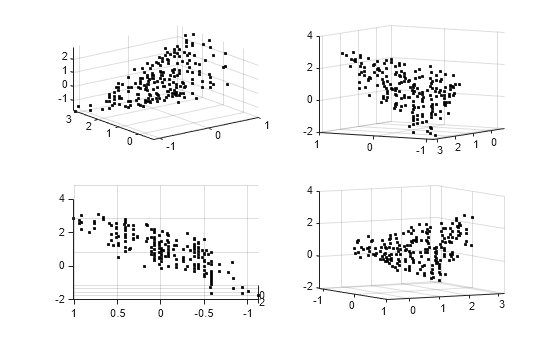
3 次元散布図を作成
scatter3 を使用して、パレート フロント上に点をプロットします。
figure
subplot(2,2,1)
scatter3(f(:,1),f(:,2),f(:,3),'k.');
subplot(2,2,2)
scatter3(f(:,1),f(:,2),f(:,3),'k.');
view(-148,8)
subplot(2,2,3)
scatter3(f(:,1),f(:,2),f(:,3),'k.');
view(-180,8)
subplot(2,2,4)
scatter3(f(:,1),f(:,2),f(:,3),'k.');
view(-300,8)
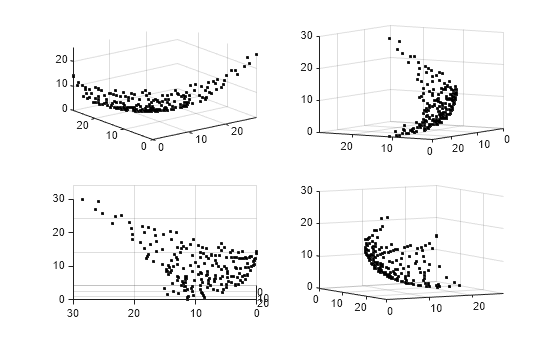
プロットをインタラクティブに回転すると、その構造をよりよく把握できるようになります。
補間表面プロット
パレート フロントを面として表示するには、散布補間を作成します。
figure
F = scatteredInterpolant(f(:,1),f(:,2),f(:,3),'linear','none');
結果のサーフェスをプロットするには、x-y 空間に最小値から最大値までのメッシュを作成します。次に、補間されたサーフェスをプロットします。
sgr = linspace(min(f(:,1)),max(f(:,1)));
ygr = linspace(min(f(:,2)),max(f(:,2)));
[XX,YY] = meshgrid(sgr,ygr);
ZZ = F(XX,YY);
パレート点と面を一緒にプロットします。
figure
subplot(2,2,1)
surf(XX,YY,ZZ,'LineStyle','none')
hold on
scatter3(f(:,1),f(:,2),f(:,3),'k.');
hold off
subplot(2,2,2)
surf(XX,YY,ZZ,'LineStyle','none')
hold on
scatter3(f(:,1),f(:,2),f(:,3),'k.');
hold off
view(-148,8)
subplot(2,2,3)
surf(XX,YY,ZZ,'LineStyle','none')
hold on
scatter3(f(:,1),f(:,2),f(:,3),'k.');
hold off
view(-180,8)
subplot(2,2,4)
surf(XX,YY,ZZ,'LineStyle','none')
hold on
scatter3(f(:,1),f(:,2),f(:,3),'k.');
hold off
view(-300,8)
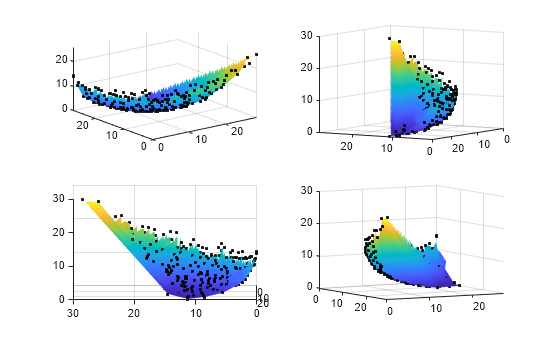
プロットをインタラクティブに回転すると、その構造をよりよく把握できるようになります。
制御変数空間におけるパレート集合のプロット
'psplotparetox' プロット関数を使用すると、パレート集合上の点のプロットを取得できます。
options.PlotFcn = 'psplotparetox';
[x,f] = paretosearch(fun,3,[],[],[],[],lb,ub,[],options);
Pareto set found that satisfies the constraints. Optimization completed because the relative change in the volume of the Pareto set is less than 'options.ParetoSetChangeTolerance' and constraints are satisfied to within 'options.ConstraintTolerance'.
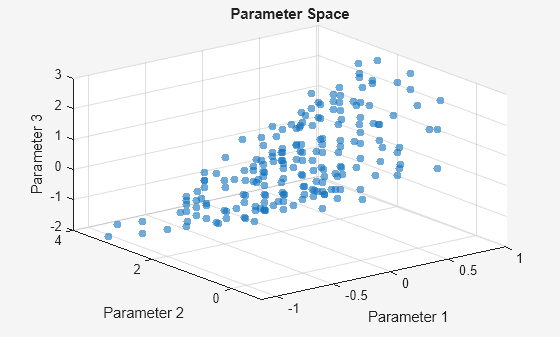
あるいは、パレート集合内の x 値の散布図を作成します。
figure
subplot(2,2,1)
scatter3(x(:,1),x(:,2),x(:,3),'k.');
subplot(2,2,2)
scatter3(x(:,1),x(:,2),x(:,3),'k.');
view(-148,8)
subplot(2,2,3)
scatter3(x(:,1),x(:,2),x(:,3),'k.');
view(-180,8)
subplot(2,2,4)
scatter3(x(:,1),x(:,2),x(:,3),'k.');
view(-300,8)
このセットには透明な表面がありません。プロットをインタラクティブに回転すると、その構造をよりよく把握できるようになります。
パラレルプロット
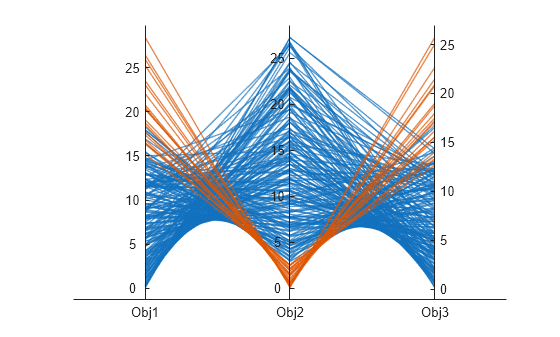
平行座標プロットを使用してパレート集合をプロットできます。任意の数の次元に対して平行座標プロットを使用できます。プロットでは、各色線が 1 つのパレート点を表し、各座標変数が関連する垂直線にプロットされます。parellelplot を使用して目的関数の値をプロットします。
figure
p = parallelplot(f);
p.CoordinateTickLabels =["Obj1";"Obj2";"Obj3"];
Obj2 の値の下位 10 分の 1 にあるパレート点を色分けします。
minObj2 = min(f(:,2));
maxObj2 = max(f(:,2));
grpRng = minObj2 + 0.1*(maxObj2-minObj2);
grpData = f(:,2) <= grpRng;
p.GroupData = grpData;
p.LegendVisible = "off";