トゥルース データの解析とトゥルース モデルの定義
この例では、記録されたトゥルース データを解析してトゥルース オブジェクトの運動をモデル化し、トゥルース オブジェクトをトラックするフィルターを構成する方法を示します。
トゥルース データのソースとタイプ
記録されたトゥルース データには、次の 3 つの典型的なソースがあります。
シミュレーション: データは、シミュレーションされたシナリオを実行し、各トゥルース オブジェクトの運動学を記録することによって収集されます。記録されたデータは欠点およびノイズがなく、任意の更新頻度で取得でき、あらゆる運動学的時間微分を記録できるという意味で完全です。
計測ありのテスト: データは飛行テスト中に収集され、GPS と慣性計測ユニットを装備して対象トゥルース オブジェクトの計測を行います。記録されたデータは通常、低ノイズであり、約 1 Hz で記録され、限られた数の運動学的微分 (通常は位置と速度のみ) が含まれます。
ラベル付きデータ: データは、道路上での走行など、制御されていないテスト中に収集されます。センサー データは後で手動または半自動でラベル付けされ、トゥルース推定値が生成されます。データは通常、ノイズ レベルが高く、誤った識別が含まれる可能性があり、更新頻度もさまざまです。
この例では、シミュレーションおよび計測ありのテストで取得したトゥルース オブジェクトの記録の解析に焦点を当てています。
シミュレーションされたトゥルースの解析
このセクションでは、最初のケースに焦点を当てます。つまり、シミュレーションで記録されたトゥルースを扱います。この例は、[1] で説明されているBenchmark Trajectories for Multi-Object Trackingのシナリオに基づいています。
ベンチマーク軌跡シナリオを、各トゥルース オブジェクトの時間、位置、および速度の履歴をリストするテーブルに変換します。関数 scenarioToTruth は、このスクリプトの下部にあるサポート関数で提供されます。
load("TruthScenario","scenario"); updateRate =10; includeVelocity =
true; includeAcceleration =
false; truthTables = scenarioToTruth(scenario,UpdateRate=updateRate,includeVelocity=includeVelocity,IncludeAcceleration=includeAcceleration);
トゥルース軌跡を可視化します。
f = figure;
hold on;
for i = 1:numel(truthTables)
    scatter3(truthTables{i}.Position(:,2),truthTables{i}.Position(:,1),-truthTables{i}.Position(:,3),1,lines(1));
end
xlabel('East [m]');
ylabel('North [m]');
zlabel('Up [m]');
view(3);
axis equal;
![Figure contains an axes object. The axes object with xlabel East [m], ylabel North [m] contains 6 objects of type scatter.](../../examples/fusion/win64/AnalyzeTruthDataAndDefineTargetModelExample_01.png)
これはターゲットが急に方向を変えていることを示しており、ターゲットが操縦されていることを意味します。速度、速度の変化率 (接線加速度)、および回転 (法線加速度) に注目すると、ターゲットの運動を解析しやすくなります。このスクリプトに付属している関数 addManeuvers は真理値表を解析し、速度、接線加速度、および法線加速度を追加します。
操縦を解析してテーブルに追加するプロセスには、以下のステップが含まれます。
速度と加速度がトゥルースで提供されていない場合は、単純な微分を使用してデータを完成させます。シミュレーションから得られた完全なデータでは、このステップは簡単です。
速度ベクトルのノルムを使用して、各タイム ステップにおける速度を計算します。
記録は北-東-下の座標で行われるため、昇降速度には速度の z 成分を使用します。
各タイム ステップにおける速度ベクトルと加速度ベクトルを使用して、各タイム ステップにおける接線加速度を求めます。
加速度のノルムと接線加速度から法線加速度を計算します。
truthTables = addManeuvers(truthTables);
これで、このスクリプトに付属している plotManeuvers 関数を使用することで、操縦を確認することが容易になりました。minat と minan の値を使用して、操縦とみなされる最小接線加速度および最小法線加速度をそれぞれ定義します。次の図では、青色のセクションは加速のない等速区間を表し、緑色のセクションは速度を上げながらの直線に沿った飛行を表し、赤色のセクションは速度を下げながらの直線に沿った飛行を表し、黄色のセクションは旋回を表します。
minat =1; % Minimum tangential acceleration, m/s^2 minan =
1; % Minimum normal acceleration, m/s^2 plotManeuvers(f,truthTables,minat,minan);
![Figure contains an axes object. The axes object with xlabel East [m], ylabel North [m] contains 6 objects of type scatter.](../../examples/fusion/win64/AnalyzeTruthDataAndDefineTargetModelExample_02.png)
このスクリプトに付属している summarizeManeuvers 関数を使用して、各ターゲットの操縦限界を要約します。ターゲットは速度の変更と回転を同時に行うことがあるため、テーブル内のパーセンテージの合計が 100 にならない場合があることに注意してください。
summaryTable = summarizeManeuvers(truthTables,minat,minan)
summaryTable=6×10 table
    Constant Velocity %    Turn %    Speed Change %    Min Speed    Max Speed    Min Climb Rate    Max Climb Rate    Min Tangential Acceleration    Max Tangential Acceleration    Max Normal Acceleration
    ___________________    ______    ______________    _________    _________    ______________    ______________    ___________________________    ___________________________    _______________________

          76.661           23.339             0         289.34       289.71                0                 0                -0.33228                        0.38319                      35.447
          74.446           25.338        3.7277         301.06       305.69          -32.286          0.023165                 -5.4425                         5.2036                      41.087
          73.582            17.45        20.367          274.3       458.75                0                 0                   -14.9                          5.023                      44.198
          56.942           19.287        36.629         251.45       411.71         -0.74238            55.382                 -3.2049                          7.253                      59.918
          32.037           33.117        60.238         274.46       453.79          -1.8727            281.49                  -40.11                         40.893                      72.883
          41.221           28.795        55.592         208.87       426.84          -167.82             1.074                 -13.831                         11.176                      72.561
記録されたトゥルースの解析
これまでの解析では、シミュレーションから得られた完全なトゥルースを使用しました。これは有益ですが、より一般的なケースとしては、テストでターゲットを計測し、その GPS 位置を記録して解析します。
記録されたトゥルースには固有の測定ノイズがあり、更新頻度が低く、測定値が欠損していることがよくあります。
この例では、gpsSensor System object と補助関数 simulateRecording を使用して、これらの影響をシミュレーションします。
sampleRate =1 ; % Sampling rate of the instrumentation systems horizontalPositionAccuracy =
1.6; % Horizontal accuracy of the instrumentation systems verticalPositionAccuracy =
3; % Vertical accuracy of the instrumentation systems velocityAccuracy =
0.1; % Velocity accuracy of the instrumentation systems decayFactor =
0.9; % Decay factor of the instrumentation systems gps = gpsSensor(SampleRate=sampleRate, ... HorizontalPositionAccuracy=horizontalPositionAccuracy, ... VerticalPositionAccuracy=verticalPositionAccuracy, ... VelocityAccuracy=velocityAccuracy, ... DecayFactor=decayFactor); recordingProbability =
0.9; % Probability of sample being reported recordedTables = simulateRecording(scenario,gps,recordingProbability);
ノイズのあるトゥルース データの平滑化
記録されたデータのノイズの量によっては、解析前にデータの平滑化が必要な場合があります。これはオプションのステップです。
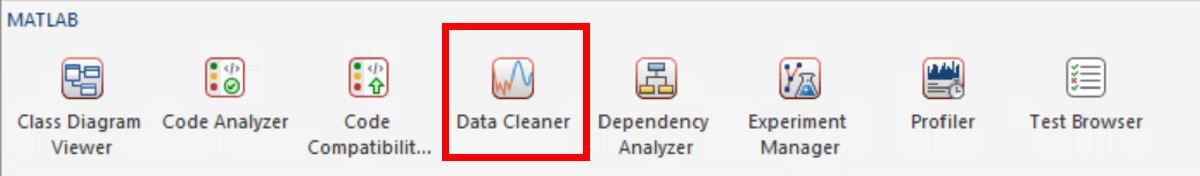
これを行うために、MATLAB® データ クリーナー アプリを使用し、[データの平滑化] オプションを使用して記録を平滑化します。次のイメージは、MATLAB ウィンドウでデータ クリーナー アプリに移動する方法を示しています。
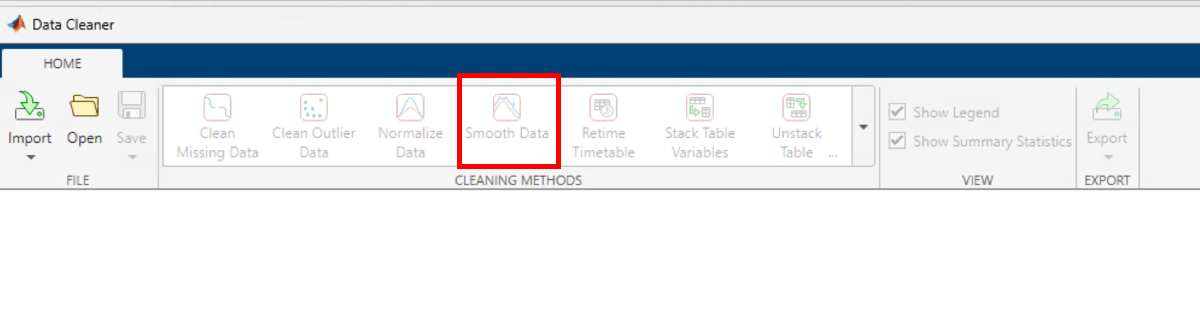
次のイメージは、データ クリーナー アプリ内で [データの平滑化] ツールを見つける方法を示しています。
アプリからエクスポートされた smoothRecording 関数とガウス オプションを使用してデータを平滑化します。timewindow の選択は、データのサンプル レートによって異なります。
timewindow = 5;
recordedTables = smoothRecording(recordedTables, timewindow);
5;
recordedTables = smoothRecording(recordedTables, timewindow);比較のためにシミュレーションによるトゥルースを解析します。
recordedTables = addManeuvers(recordedTables);
minat = 1; % Minimum tangential acceleration, m/s^2
minan = 1; % Minimum normal acceleration, m/s^2
plotManeuvers(f,recordedTables,minat,minan);
![Figure contains an axes object. The axes object with xlabel East [m], ylabel North [m] contains 6 objects of type scatter.](../../examples/fusion/win64/AnalyzeTruthDataAndDefineTargetModelExample_05.png)
summaryTable = summarizeManeuvers(recordedTables,minat,minan)
summaryTable=6×10 table
    Constant Velocity %    Turn %    Speed Change %    Min Speed    Max Speed    Min Climb Rate    Max Climb Rate    Min Tangential Acceleration    Max Tangential Acceleration    Max Normal Acceleration
    ___________________    ______    ______________    _________    _________    ______________    ______________    ___________________________    ___________________________    _______________________

          73.143           26.857             0          285.5        289.8          -0.1386          0.099782                -0.77035                        0.89733                      27.344
          70.482           29.518        4.2169         296.23       305.01          -31.969           0.12531                  -1.411                         1.9341                      36.395
          69.822           21.302         20.71         274.39       457.39        -0.091943           0.13917                 -10.988                        0.89954                       37.77
          52.632           26.901        40.351         245.29       411.86         -0.61134            54.704                 -4.1592                         5.6348                       54.84
          29.697           39.394        60.606         282.73       449.24         -0.12708            272.82                 -8.0657                         5.9692                      64.294
          40.237           35.503        56.213         205.31       426.97          -120.24           0.13243                 -10.655                         7.2804                      64.799
予想どおり、解析された記録データの結果は、シミュレーションされたトゥルースの解析と完全には一致していません。特に、記録速度にノイズが多いため、接線加速度の値が正確ではありません。ただし、他の値では、最小速度と最大速度の大まかな大きさ、さらには最大法線加速度の大まかな大きさ (約 7G の回転) が得られています。
トゥルースの仕様の定義
ここまでで、複数のトゥルース オブジェクトの記録データを解析しました。トラッキング アルゴリズムを定義する次のステップとして、トラッキング フィルターとマルチオブジェクト トラッカーを定義できるようにする方法でこの知識を取得する 1 つ以上のトゥルースの仕様を提供します。
すべてのターゲットに基づいて 1 つのトゥルースの仕様を指定するために、summaryTable を使用して速度と加速度の範囲を定義します。
truthSpec = struct(Speed = [min(summaryTable.("Min Speed")),max(summaryTable.("Max Speed"))], ...
    ClimbRate = [min(summaryTable.("Min Climb Rate")),max(summaryTable.("Max Climb Rate"))], ...
    TangentialAcceleration = [min(summaryTable.("Min Tangential Acceleration")),max(summaryTable.("Max Tangential Acceleration"))], ...
    MaxNormalAcceleration = max(summaryTable.("Max Normal Acceleration")));
disp(truthSpec);
                     Speed: [205.3083 457.3947]
                 ClimbRate: [-120.2439 272.8185]
    TangentialAcceleration: [-10.9879 7.2804]
     MaxNormalAcceleration: 64.7988
このトゥルースの仕様に基づいてトラッキング フィルターを定義する方法は数多くあります。簡単にするために、等速モデルで構成された拡張カルマン フィルターを使用します。最初のターゲット位置を使用し、一般的な 100 メートルの位置測定の不確かさを指定します。
state = zeros(6,1);
state(1:2:5) = recordedTables{1}.Position(1,:);
cvekf = trackingEKF(@constvel,@cvmeas,state, ...
    StateTransitionJacobianFcn=@constveljac, ...
    MeasurementJacobianFcn=@cvmeasjac, ...
    StateCovariance=100^2*eye(6), ...
    HasAdditiveProcessNoise=false, ...
    ProcessNoise = eye(3), ... % Just define the size for now
    HasAdditiveMeasurementNoise=true, ...
    MeasurementNoise = eye(3));
トゥルースの仕様を使用して、前のステップで測定されていない、速度に関連する未知の StateCovariance 要素を定義します。
cvekf.StateCovariance(2,2) = truthSpec.Speed(2)^2; % Corresponds to the unknown Vx
cvekf.StateCovariance(4,4) = truthSpec.Speed(2)^2; % Corresponds to the unknown Vy
cvekf.StateCovariance(6,6) = max(abs(truthSpec.ClimbRate)); % % Corresponds to the unknown Vz
disp(cvekf.StateCovariance);
   1.0e+05 *

    0.1000         0         0         0         0         0
         0    2.0921         0         0         0         0
         0         0    0.1000         0         0         0
         0         0         0    2.0921         0         0
         0         0         0         0    0.1000         0
         0         0         0         0         0    0.0027
同様に、加速度成分を使用して ProcessNoise を定義します。最大加速度は最悪のケースの ProcessNoise ですが、より良い推定値を使用できます。
maxTotalAccelerationSquared = max(abs(truthSpec.TangentialAcceleration))^2+truthSpec.MaxNormalAcceleration^2;
cvekf.ProcessNoise = maxTotalAccelerationSquared * eye(3);
disp(cvekf.ProcessNoise);
   1.0e+03 *

    4.3196         0         0
         0    4.3196         0
         0         0    4.3196
まとめ
この例では、ターゲットが実行する操縦の推定値を取得するためにトゥルース データを解析する方法を学びました。この解析の結果を使用して、適切なターゲット運動モデルを定義し、速度と加速度の範囲を提供できます。これらの値をトラッキング フィルター内で使用すると、フィルターの状態の共分散の初期化とプロセス ノイズの基盤にすることが可能です。
参考文献
W.D. Blair, G. A. Watson, T. Kirubarajan, Y. Bar-Shalom, "Benchmark for Radar Allocation and Tracking in ECM."Aerospace and Electronic Systems IEEE Trans on, vol. 34. no. 4. 1998.
サポート関数
"scenarioToTruth" はシナリオから真理値表を記録します。この関数は、lookupPose メソッドを実装する軌跡をもつトゥルース オブジェクトのみを記録します。
function truthTables = scenarioToTruth(scenario,options)
arguments
    scenario (1,1) trackingScenario
    options.UpdateRate (1,1) double = 100; % Update rate in Hz
    options.IncludeVelocity (1,1) logical = true; % Record velocity
    options.IncludeAcceleration (1,1) logical = false; % Record acceleration
end
startTime = 0;
stopTime = scenario.StopTime;
timestep = 1/options.UpdateRate;
sampleTimes = (startTime:timestep:stopTime);
numTruths = numel(scenario.Platforms);
truthTables = cell(1,numTruths);
includeInOutput = false(1,numTruths);
for i = 1:numTruths
    if ismethod(scenario.Platforms{i}.Trajectory, 'lookupPose')
        includeInOutput(i) = true;
        [pos, ~, vel, acc, ~] = lookupPose(scenario.Platforms{i}.Trajectory, sampleTimes);
        truthTables{i} = table(sampleTimes(:),pos,'VariableNames',["Time","Position"]);
        if options.IncludeVelocity
            truthTables{i} = addvars(truthTables{i}, vel, NewVariableNames = "Velocity");
        end
        if options.IncludeAcceleration
            truthTables{i} = addvars(truthTables{i}, acc, NewVariableNames = "Acceleration");
        end
    end
end
truthTables = truthTables(includeInOutput);
end
"addManeuvers" は速度、接線加速度、および法線加速度を真理値表に追加します。
function truthTables = addManeuvers(truthTables)
for i = 1:numel(truthTables)
    vel = velocity(truthTables{i});
    if ~ismember('Speed',truthTables{i}.Properties.VariableNames)
        speed = vecnorm(vel,2,2);
        truthTables{i} = addvars(truthTables{i},speed,NewVariableNames="Speed");
    end
    if ~ismember('ClimbRate',truthTables{i}.Properties.VariableNames)
        climbRate = -vel(:,3); % Remember that the data is North-East-Down, so climb rate is -Vz
        truthTables{i} = addvars(truthTables{i},climbRate,NewVariableNames="ClimbRate");
    end
    [at,an] = acceleration(truthTables{i});
    if ~ismember("TangentialAcceleration",truthTables{i}.Properties.VariableNames)
        truthTables{i} = addvars(truthTables{i},at,NewVariableNames="TangentialAcceleration");
    end
    if ~ismember("NormalAcceleration",truthTables{i}.Properties.VariableNames)
        truthTables{i} = addvars(truthTables{i},an,NewVariableNames="NormalAcceleration");
    end
end
end
"velocity" はトゥルース オブジェクトの速度を返します。
function vel = velocity(truth)
arguments
    truth table
end

% Check if there is a column by the name Velocity. If no, use position to find velocity
[hasVelocity,velidx] = ismember('Velocity', truth.Properties.VariableNames);

if hasVelocity
    vel = table2array([truth(:,velidx)]);
else
    dt = diff(truth.Time);
    vel = diff(truth.Position,1,1)./dt;
    vel(end+1,:) = vel(end,:); % Make sure number of rows remains same as the table
end
end
"acceleration" はトゥルース オブジェクトの接線加速度成分および法線加速度成分を返します。
function [at, an] = acceleration(truth)
arguments
    truth table
end

vel = velocity(truth);
vmag = vecnorm(vel,2,2);
dt = diff(truth.Time);
dt(end+1) = 2*dt(end)-dt(end-1);

% Check if there is a column by the name Acceleration. If no, use velocity
% to find the acceleration
[hasAcc,accidx] = ismember('Acceleration', truth.Properties.VariableNames);
if hasAcc
    acc = table2array([truth(:,accidx)]);
else
    dvel = diff(vel,1,1);
    dvel(end+1,:) = 0;
    acc = dvel./dt;
end

% Compute the tangential acceleration as d|v|/dt
dvmag = diff(vmag,1,1);
dvmag(end+1) = dvmag(end);
at = dvmag./dt;

amag = vecnorm(acc,2,2);
an = sqrt(max(amag.^2-at.^2,0));
end
"plotManeuvers" は操縦をプロットします。
function plotManeuvers(f,truthTables,minat,minan)
clf(f);
hold on
colors = [0     0.447 0.741;... % Blue for constant velocity
          0.1   0.741 0.1;  ... % Green for increasing speed
          0.741 0.1   0.1;  ... % Red for decreasing speed
          0.929 0.694 0.125];   % Yellow for turning
for i = 1:numel(truthTables)
    increasingSpeed = truthTables{i}.TangentialAcceleration > minat;
    decreasingSpeed = truthTables{i}.TangentialAcceleration < -minat;
    changingDirection = abs(truthTables{i}.NormalAcceleration) > minan;
    color = colors(1,:) .* (~increasingSpeed & ~decreasingSpeed & ~changingDirection) + ...
        colors(2,:) .* increasingSpeed + colors(3,:) .* decreasingSpeed + colors(4,:) .* changingDirection;
    scatter3(truthTables{i}.Position(:,2),truthTables{i}.Position(:,1),-truthTables{i}.Position(:,3),1,color);
end
xlabel('East [m]');
ylabel('North [m]');
zlabel('Altitude [m]');
view(3);
axis equal;
end
"summarizeManeuvers" は操縦の概要を提供します。
function summaryTable = summarizeManeuvers(truthTables,minat,minan)
names = ["Constant Velocity %", "Turn %", "Speed Change %", ...
    "Min Speed", "Max Speed", "Min Climb Rate", "Max Climb Rate", ...
    "Min Tangential Acceleration", "Max Tangential Acceleration", "Max Normal Acceleration"];
summaryTable = table('Size', [numel(truthTables),numel(names)], VariableTypes=repmat({'double'},1,numel(names)), VariableNames=names);
for i = 1:numel(truthTables)
    numSteps = size(truthTables{i},1);
    summaryTable.(names(1))(i) = 100*nnz(abs(truthTables{i}.TangentialAcceleration) <= minat & truthTables{i}.NormalAcceleration < minan)/numSteps;
    summaryTable.(names(2))(i) = 100*nnz(truthTables{i}.NormalAcceleration > minan)/numSteps;
    summaryTable.(names(3))(i) = 100*nnz(abs(truthTables{i}.TangentialAcceleration) > minat)/numSteps;
    summaryTable.(names(4))(i) = min(truthTables{i}.Speed);
    summaryTable.(names(5))(i) = max(truthTables{i}.Speed);
    summaryTable.(names(6))(i) = min(truthTables{i}.ClimbRate);
    summaryTable.(names(7))(i) = max(truthTables{i}.ClimbRate);
    summaryTable.(names(8))(i) = min(truthTables{i}.TangentialAcceleration);
    summaryTable.(names(9))(i) = max(truthTables{i}.TangentialAcceleration);
    summaryTable.(names(10))(i) = max(truthTables{i}.NormalAcceleration);
end
end
"simulateRecording" はノイズを追加し、更新頻度を下げ、一部の測定値を削除することで、トゥルースの記録をシミュレーションします。
function recordedTruth = simulateRecording(scenario,gps,recordingProbability)
arguments
    scenario (1,1) trackingScenario
    gps (1,1) gpsSensor
    recordingProbability (1,1) double {mustBeNonnegative,mustBeLessThanOrEqual(recordingProbability,1)} = 0.99
end

truthTables = scenarioToTruth(scenario,UpdateRate=gps.SampleRate,includeVelocity=false,IncludeAcceleration=false);
recordedTruth = truthTables;
for i = 1:numel(truthTables)
    release(gps);
    truePosition = [truthTables{i}.Position];
    trueVelocity = velocity(truthTables{i});
    [posLLA,vel] = gps(truePosition,trueVelocity);
    posned = lla2ned(posLLA,[0 0 0],"ellipsoid");
    recordedTruth{i}.Position = posned;
    recordedTruth{i}.Velocity = vel;
    includeInOutput = rand(size(truthTables{i},1),1) < recordingProbability;
    recordedTruth{i} = recordedTruth{i}(includeInOutput,:);
end
end
"smoothRecording" は記録されたノイズの多いトゥルース データを平滑化します。これはデータ クリーナー アプリからエクスポートされたものですが、複数の記録された真理値表を処理するラッパーが含まれていることに注意してください。
function recordedTruth = smoothRecording(recordedTruth, timewindow)
    if isa(recordedTruth,'cell')
        recordedTruth = cellfun(@(t) smoothOneTruth(t,timewindow), recordedTruth, UniformOutput=false);
    else
        recordedTruth = smoothOneTruth(recordedTruth,timewindow);
    end
end

function oneTruth = smoothOneTruth(oneTruth, timewindow)
oneTruth = splitvars(oneTruth,"Position",NewVariableNames=["Position_1","Position_2","Position_3"]);
oneTruth = smoothdata(oneTruth,"gaussian",timewindow);
oneTruth = mergevars(oneTruth,["Position_1","Position_2","Position_3"],...
    NewVariableName = "Position");
if ismember("Velocity",oneTruth.Properties.VariableNames)
    oneTruth = splitvars(oneTruth,"Velocity",NewVariableNames=["Velocity_1","Velocity_2","Velocity_3"]);
    oneTruth = smoothdata(oneTruth,"gaussian",timewindow);
    oneTruth = mergevars(oneTruth,["Velocity_1","Velocity_2","Velocity_3"],...
        NewVariableName = "Velocity");
end
end