plotCoverage
R2026bPlot sensor beams and scan limits in
trackingGlobeViewer
Syntax
Description
plotCoverage(
plots the sensor beams and scan limits specified by the array of coverage configuration
structures viewer,configs)configs.
Note
When the CoverageMode property of the
viewer is set to "Beam", the function plots
only the sensor or emitter beam. When the CoverageMode property is
set to "Coverage", the function plots the scan limits of the
sensor.
plotCoverage(
plots the sensor coverages specified by the sensor data and sensor specification. (since R2026b)viewer,sensorData,sensorSpecs)
Note
To plot sensor coverages using this syntax, set the
CoverageMode property of the
viewer to "Beam".
plotCoverage(___,
specifies options using one or more name-value arguments. For example,
Name=Value)plotCoverage(viewer,configs,Color=[1 0 0]) specifies the color of the
plotted coverages as the RGB triplet [1 0 0].
Examples
Create a tracking scenario, add a platform in the scenario, and mount a radar sensor on the platform.
scene = trackingScenario(IsEarthCentered=true);
r = fusionRadarSensor(1,RangeLimits=[0 5e6]);
radarTowerLLA = [10 10 1000];
platform(scene,'Position',radarTowerLLA,'Sensors',r);
Use the coverageConfig function to obtain the coverage configuration of the radar sensor.
covcon = coverageConfig(scene);
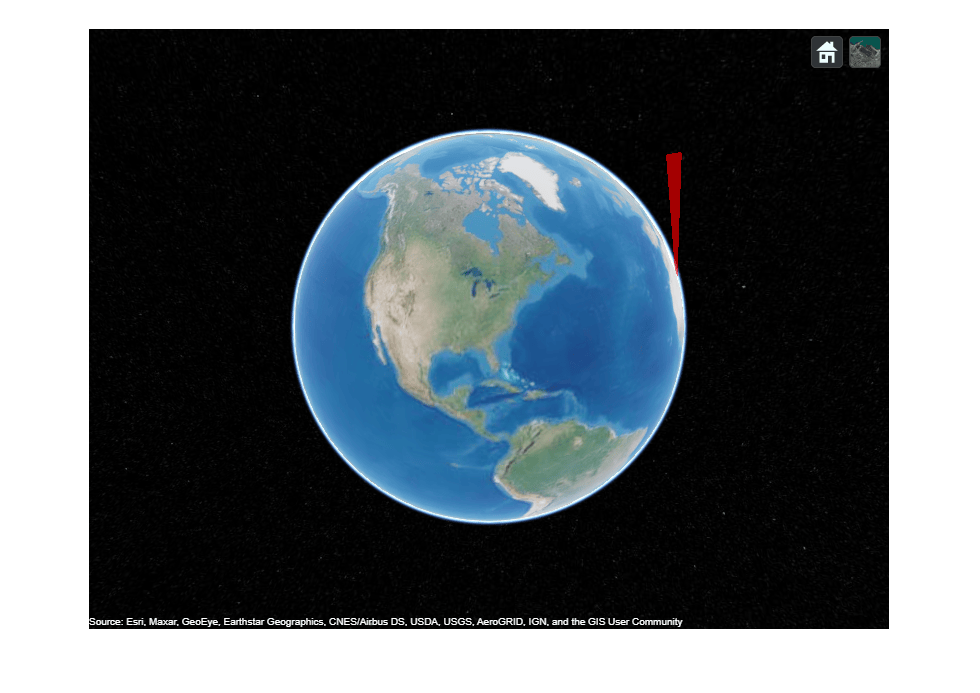
Create a tracking globe viewer and plot the coverage.
viewer = trackingGlobeViewer;
plotCoverage(viewer,covcon,"ECEF",Color=[1 0 0])
Take a snapshot and show the results.
drawnow
snapshot(viewer)
Create a tracking globe viewer and specify its reference location and camera position.
refloc = [42.39423231362 -70.95934958874 0];
mapViewer = trackingGlobeViewer('ReferenceLocation',refloc,'Basemap','streets-dark');
campos(mapViewer,refloc + [0 0 1e5]);
Load the sensor data and specifications for a monostatic radar and an ESM radar.
load("sensorDataFromTwoSensors.mat");Plot coverages for both radars and specify the color for the detections from each sensor. Take a snapshot to show the results.
plotCoverage(mapViewer, {radar1Data,radar2Data}, ...
    {radar1Spec,radar2Spec},Color=[1 0 0; 0 1 0],Alpha=0.1)
drawnow
pause(20)
snapshot(mapViewer)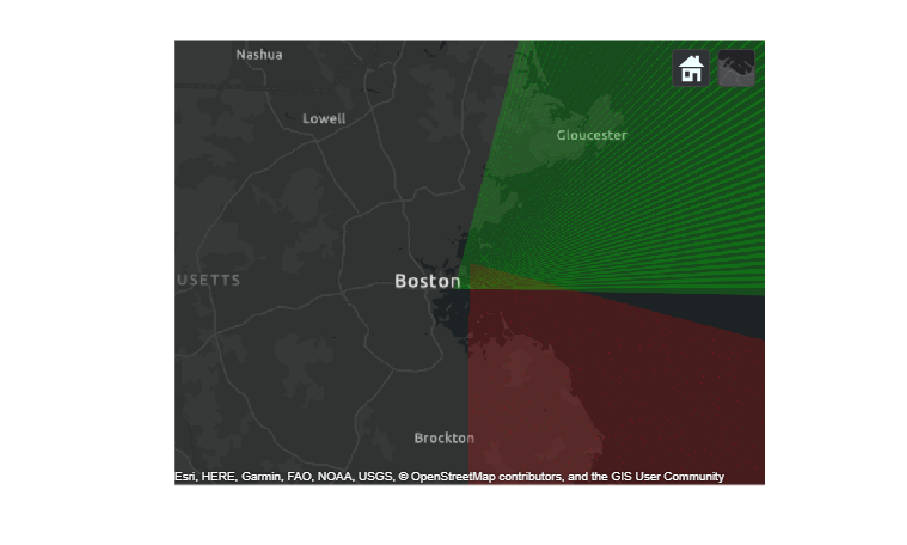
Additionally, you can plot the data of the radars using the plotSensorData function.
plotSensorData(mapViewer, {radar1Data,radar2Data}, ...
    {radar1Spec,radar2Spec},Color=[1 0 0; 0 1 0])
drawnow
snapshot(mapViewer)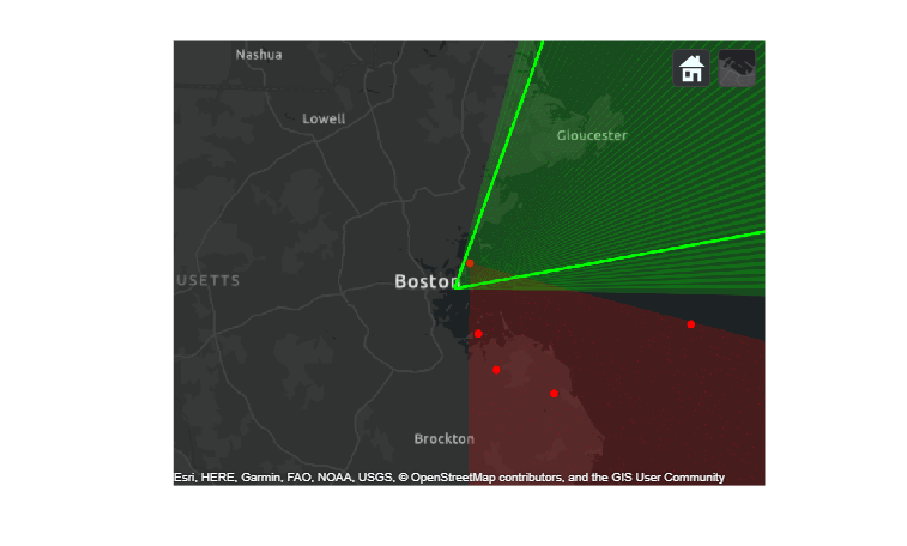
Input Arguments
Name-Value Arguments
Version History
Introduced in R2021bSee Also
trackingGlobeViewer | plotScenario | plotPlatform | plotTrajectory | plotDetection | plotTrack | clear | snapshot | campos | camorient | trackerSensorSpec
1 Alignment of boundaries and region labels are a presentation of the feature provided by the data vendors and do not imply endorsement by MathWorks®.

