Perform Safety Analysis on Aircraft Elevator by Running Tests
This example shows how to run a safety analysis on a fault detection system by running tests that inject faults. If you have Simulink® Test™ and Simulink Requirements™, you can run the tests that inject faults from your safety analysis by using the Safety Analysis Manager.
To perform the safety analysis in this example, you follow these steps:
Define the faults in your model.
Create the tests and specify the injected faults in the Simulink Test Manager.
Establish the pass/fail criteria of each test by using temporal assessments.
Create the safety analysis spreadsheet in the Safety Analysis Manager.
Link the tests to your safety analysis by using Requirements Toolbox links.
Define MATLAB® callback scripts in the spreadsheet that execute each test.
In this example, you perform this analysis on a model of an aircraft elevator. After running the test from the Safety Analysis Manager, you annotate the safety analysis spreadsheet by using these results.
Open the Model and Inspect Faults
View the aircraftElevatorFaultAnalyzer model and set up the faults by using the aircraftFaultTestSetup helper function. The helper function deletes the existing Simulink® Fault Analyzer™ model artifacts and replaces them with the faults used in the example.
mdlName = "aircraftElevatorFaultAnalyzer";
open_system(mdlName)
aircraftFaultTestSetup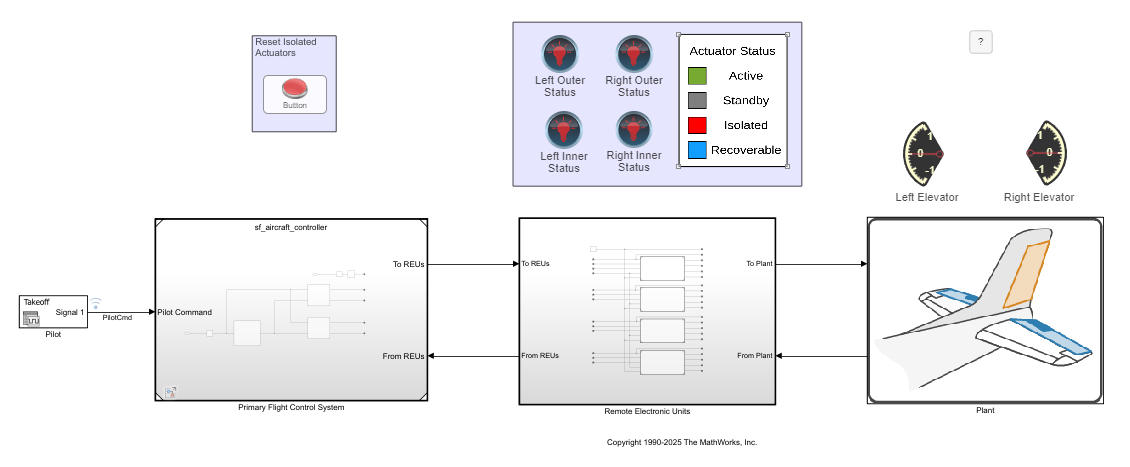
This model uses the same faults as the Verify Fault Detection Logic in Aircraft Elevator Control System example. However, this model does not use conditionals. To view the faults, open the Fault Table pane. In the Apps tab, click Fault Analyzer. In the Fault Analyzer tab, in the View section, click Fault Table.
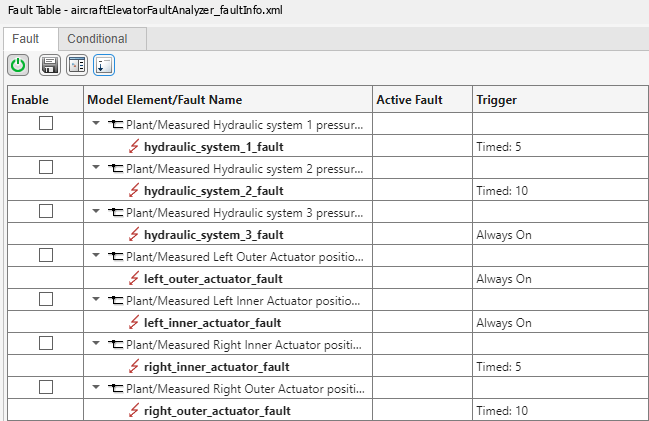
When injected, the fault on each hydraulic system drops the hydraulic pressure to 100, and the fault on each actuator holds the position at 15. To view the behaviors, in the Fault Table pane, right-click the fault and select Open fault behavior. To view the location of the fault, right-click the fault name and click Show faulted element in model canvas.
View the Tests
To verify the fault mitigation logic, this example uses tests in the Simulink Test Manager. Open the Simulink Test Manager and load the aircraft_tests_example.mldatx test file. In the Apps tab, click Simulink Test. In the Tests tab, click Simulink Test Manager. In the Simulink Test Manager, open the aircraft_tests_example.mldatx test file. Alternatively, enter this command:
sltest.testmanager.load("aircraft_tests_example.mldatx");
sltest.testmanager.view;
The Test Manager stores the tests and their properties. This test file has six test cases.
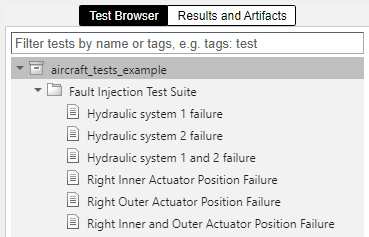
Each test case specifies the faults to inject in the fault set. To view the fault set, in the Simulink Test Manager, in the left pane, click Test Browser. Expand the test file and the test suite, and select a test. Expand the Fault Settings section to view the fault set. This image shows the fault set for the test case that injects the hydraulic_system_1_fault fault, which causes the hydraulic system 1 to fail.
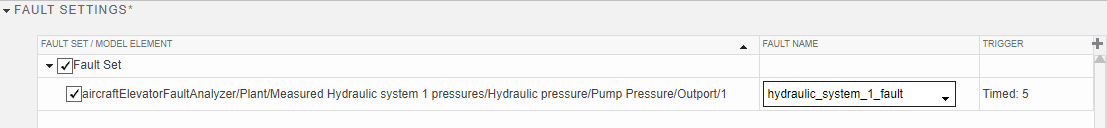
In this example, each fault set contains one or two faults, depending on the test. For example, the Hydraulic system 1 failure test injects only one fault, while the Hydraulic system 1 and 2 failure test injects two faults.
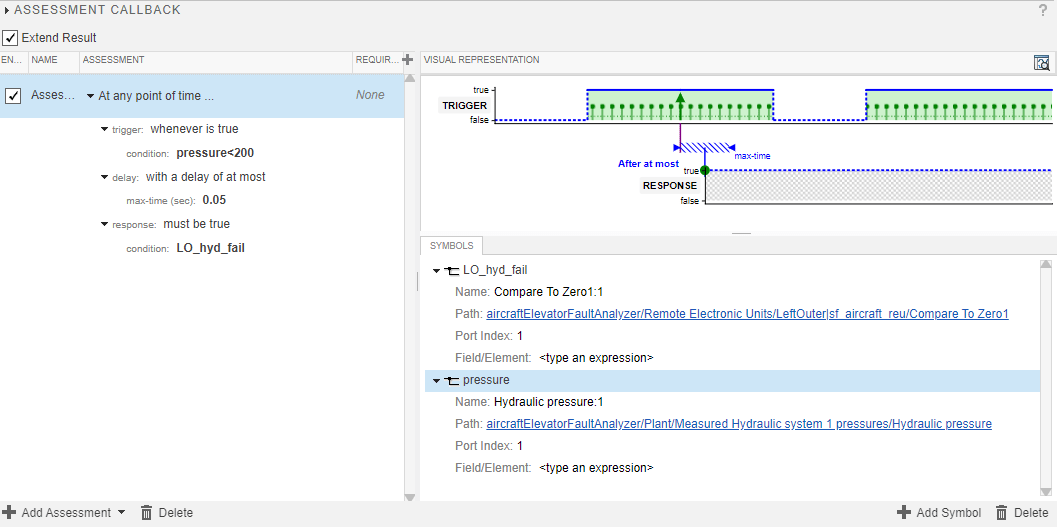
To establish the pass/fail criteria for the tests, each test case includes a temporal assessment. See Assess Temporal Logic by Using Temporal Assessments (Simulink Test). In a test, expand the Logical and Temporal Assessments section. For example, the assessment for the Hydraulic system 1 failure test checks that when the hydraulic pressure sensor goes below 200, the fault detection mechanism detects a fault within 0.05 seconds.
Create an FMEA and Link to Faults and Test Cases
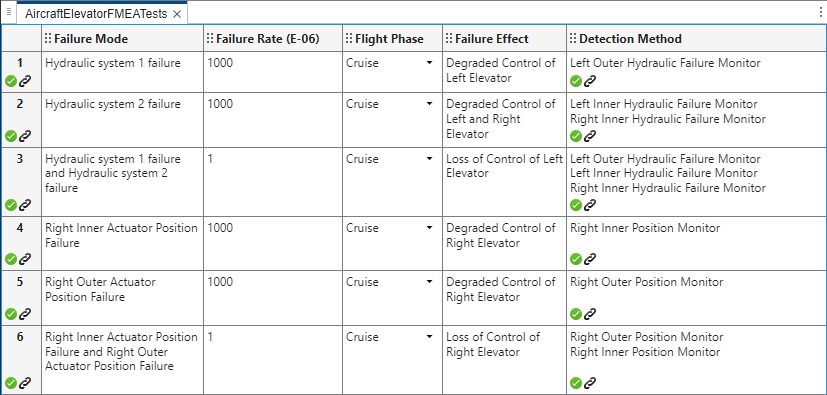
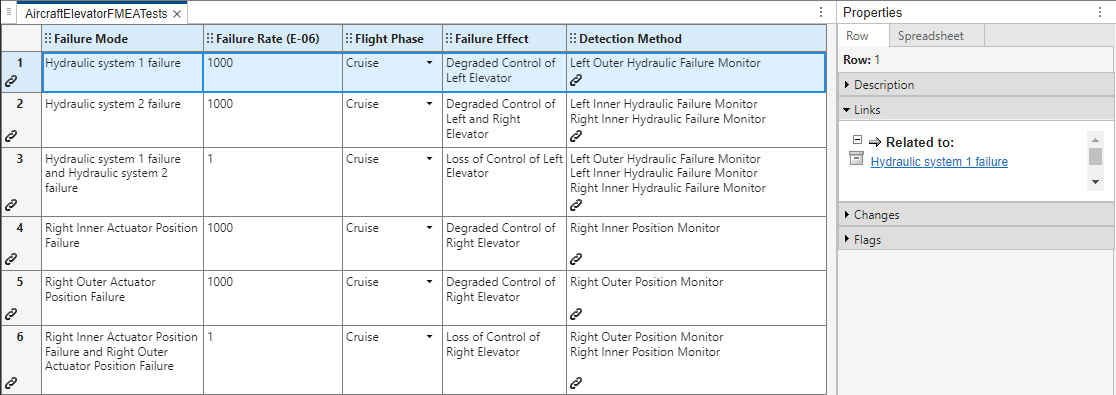
After you configure the fault sets and temporal assessments in the tests, you can use Requirements Toolbox to link the faults and tests to elements in the safety analysis. This example includes a Failure Mode and Effects Analysis (FMEA). An FMEA is a common safety analysis that analyzes if your system can detect and mitigate unintended system or component behaviors, known as failure modes, with respect to their potential effects on the system. This analysis often includes how effective fault detection logic is at detecting failure modes.
Open the FMEA spreadsheet, AircraftElevatorFMEA.mldatx, in the Safety Analysis Manager. This spreadsheet uses links in these ways:
Each row links to a test case that injects the faults that cause the failures described in the Failure Mode column.
Each cell in the Detection column links to the detection mechanism in the model.
aircraftFMEADoc = ...
    safetyAnalysisMgr.openDocument("AircraftElevatorFMEATests.mldatx");
safetyAnalysisMgr.openManager
Point to the link icon ![]() to view the links in each artifact. You can also view the links by selecting the cell or row. In the Properties pane, expand the Links section.
to view the links in each artifact. You can also view the links by selecting the cell or row. In the Properties pane, expand the Links section.
Run Callbacks to Simulate and Evaluate FMEA
To evaluate the safety analysis spreadsheet, you create and execute a callback. See Write Callbacks to Analyze Safety Analysis Manager Spreadsheets. In this example, the spreadsheet executes a callback when you click Analyze Spreadsheet. The callback runs the custom validateAircraftFMEAUsingTests function, which evaluates these conditions for each row:
If the cell in the Detection Method column does not have a link, the function adds an error flag to the cell and evaluates the next row. Otherwise, the function adds a check flag and continues to evaluate the row.
If the row is linked to more than one test case, the function adds an error flag to the row and evaluates the next row.
If the row is linked to one test case, the function runs the test case. If the test fails, the function adds an error flag to the row and evaluates the next row. If the test passes, the function adds a check flag to the row and evaluates the next row.
To view the callback code, open the validateAircraftFMEAUsingTests file.
Click Analyze Spreadsheet. The callback verifies that the linked tests pass for each row.
runAnalysis(aircraftFMEADoc)