ttdata
Description
ttdata evaluates the transition function for
observations of the threshold variable. To plot transition functions of threshold transitions,
use ttplot.
Examples
Create logistic threshold transitions at levels 0 and 5.
t = [0 5];
tt = threshold(t,Type="logistic");
tt is a threshold object. By default, the rate of each logistic transition function is 1.
Evaluate the transition function at a sequence of transition variable data from -10 to 10.
z = -10:0.01:10;
F = ttdata(tt,z);
size(F)
ans = 1×2

        2001           2
F is a 2001-by-2 vector of transition function data. Each column is the transition function data for the corresponding threshold in tt.Levels.
To facilitate comparisons among transition rates, the Type="graph" option of ttplot graphs all transition functions at the same level. This example shows how to graph transition functions each at their respective level.
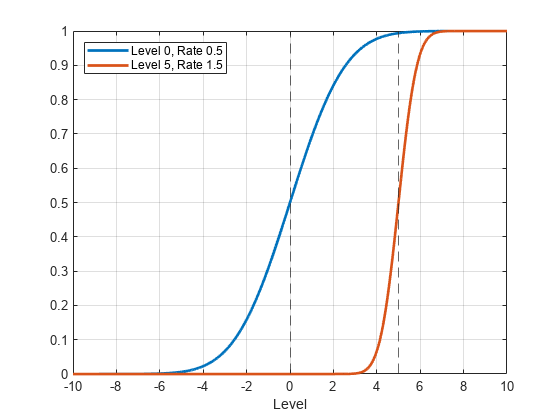
Create normal threshold transitions at levels 0 and 5 with rates 0.5 and 1.5, respectively.
tt = threshold([0 5],Type="normal",Rates=[0.5 1.5]);Evaluate the transition functions at their respective level (the default), and then evaluate them each relative to level 0. Specify a sequence of transition variable data from -10 to 10.
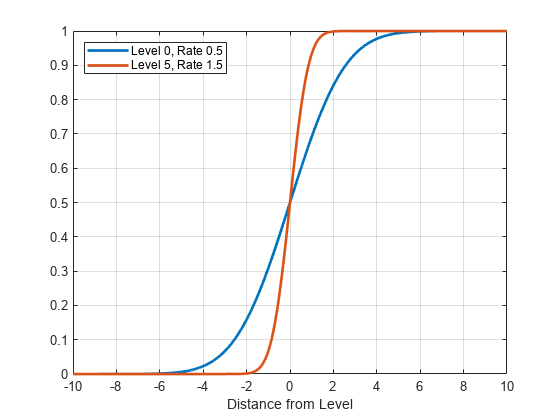
z = -10:0.01:10;
n = numel(z);

T0 = ttdata(tt,z);
T1 = ttdata(tt,z,UseZeroLevels=true);
T0 is an n-by-1 vector of raw transition function data evaluated at the grid of transition variable data. T1 is an n-by-1 vector of transition function data translated to be centered at level 0.
Plot both sets of transition functions separately.
% Raw transition functions
figure
plot(z,T0,LineWidth=2)
xline(tt.Levels,'--')
grid on
xlabel("Level")
legend(["Level 0, Rate 0.5" "Level 5, Rate 1.5"],Location="northwest")
% Shifted transition functions
figure
plot(z,T1,LineWidth=2)
grid on
xlabel("Distance from Level")
legend(["Level 0, Rate 0.5" "Level 5, Rate 1.5"],Location="northwest")
Input Arguments
Output Arguments
Version History
Introduced in R2021b