2 入力パーセプトロンによる分類
4 つの入力ベクトルを 2 つのカテゴリに分類するように、2 入力ハード制限ニューロンの学習を行います。
X の 4 つの列ベクトルのそれぞれによって 2 要素入力ベクトルが定義され、行ベクトル T によってベクトルのターゲット カテゴリが定義されます。PLOTPV を使用してこれらのベクトルをプロットできます。
X = [ -0.5 -0.5 +0.3 -0.1;  ...
      -0.5 +0.5 -0.5 +1.0];
T = [1 1 0 0];
plotpv(X,T);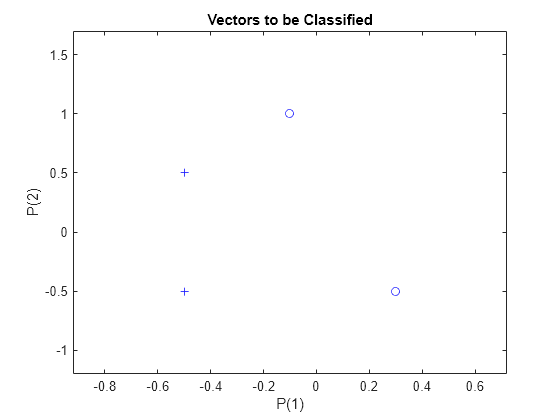
パーセプトロンによって、X の 4 つの入力ベクトルは、T によって定義された 2 つのカテゴリに適切に分類されなければなりません。パーセプトロンには HARDLIM ニューロンが含まれます。これらのニューロンは、入力空間を直線で 2 つのカテゴリ (0 および 1) に区切ることができます。
ここで、PERCEPTRON によって、1 つのニューロンがある新しいニューラル ネットワークが作成されます。次に、データに対してネットワークが構成され、重みとバイアスの初期値を確認できるようになります (通常、構成は ADAPT または TRAIN によって自動的に実行されるため、構成手順は省略できます)。
net = perceptron;
net = configure(net,X,T);
入力ベクトルは、ニューロンによる最初の分類結果で再プロットされます。
初期重みは 0 に設定されているため、任意の入力に対して出力が同じになり、プロットには分類線が表示されません。これで、学習を始めることができます。
plotpv(X,T);
plotpc(net.IW{1},net.b{1});
入力データおよびターゲット データは逐次データ (各列がタイム ステップを示す cell 配列) に変換され、3 回コピーして系列 XX および TT が形成されます。
ADAPT は、系列の各タイム ステップのネットワークを更新し、より優れた分類器として機能する新しいネットワーク オブジェクトを返します。
XX = repmat(con2seq(X),1,3);
TT = repmat(con2seq(T),1,3);
net = adapt(net,XX,TT);
plotpc(net.IW{1},net.b{1});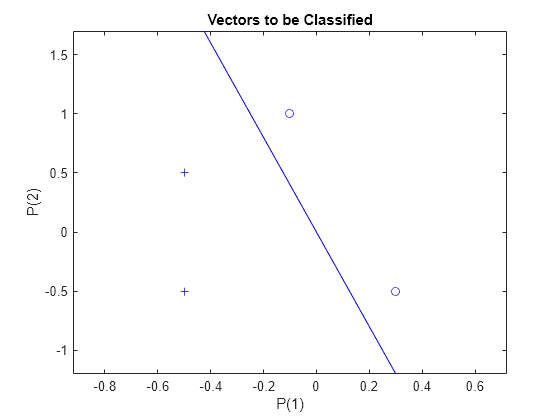
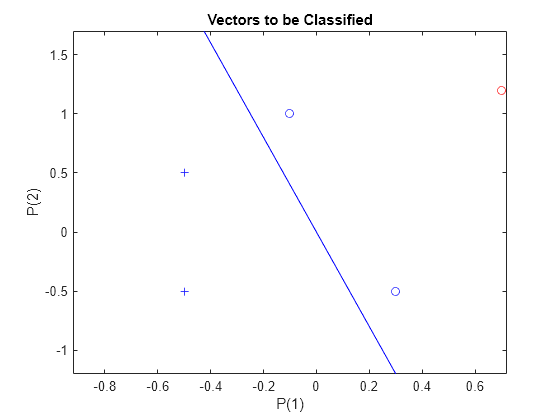
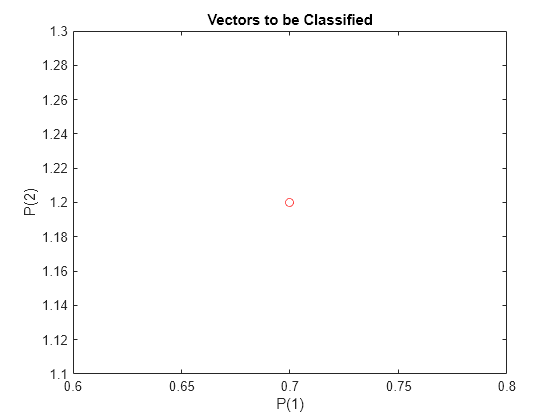
これで、SIM を使用して、[0.7; 1.2] など、他の任意の入力ベクトルが分類されるようになります。元の学習セットを使用したこの新しい点のプロットは、ネットワーク性能を示します。学習セットと区別するため、赤い色を付けます。
x = [0.7; 1.2];
y = net(x);
plotpv(x,y);
point = findobj(gca,'type','line');
point.Color = 'red';
"hold" をオンにすることで前のプロットが消去されないようにして、学習セットおよび分類線をプロットします。
パーセプトロンによって、新しい点 (赤色で表示) が、カテゴリ "1" (プラスで表示) ではなく、カテゴリ "0" (丸で表示) に正しく分類されました。
hold on;
plotpv(X,T);
plotpc(net.IW{1},net.b{1});
hold off;