メインコンテンツ

可変数の引数をもつ関数の統合

R2026b

この例では、1 つだけではなく可変数の引数を受け取る MATLAB® 関数を使用して .NET アプリケーションを作成する方法について説明します。

この例では、以下の手順を実行します。

  • MATLAB Compiler SDK™ 製品を使用して、MATLAB 関数 drawgraph を .NET クラス (Plotter) のメソッドに変換し、.NET アセンブリ (VarArgComp) でそのクラスをラップします。関数 drawgraph は入力パラメーターのプロットを表示し、Plotter クラスのメソッドとして呼び出されます。

  • Plotter クラスをインスタンス化し、MWArray を使用してデータを表すことで、C# アプリケーション (VarArgApp.cs) または Visual Basic® アプリケーション (VarArgApp.vb) でコンポーネントにアクセスします。

  • Visual Studio® .NET 開発環境を使用して VarArgDemoApp アプリケーションをビルドして実行します。

ファイル

MATLAB 関数drawgraph.m
extractcoords.m
MATLAB 関数の場所matlabroot\toolbox\dotnetbuilder\Examples\VSVersion\NET\VarArgExample\VarArgComp\
C# コードの場所matlabroot\toolbox\dotnetbuilder\Examples\VSVersion\NET\VarArgExample\VarArgCSApp\VarArgApp.cs
Visual Basic コードの場所matlabroot\toolbox\dotnetbuilder\Examples\VSVersion\NET\VarArgExample\VarArgVBApp\VarArgApp.vb

手順

  1. MATLAB 製品に付属している以下のフォルダーを作業フォルダーにコピーします。

    matlabroot\toolbox\dotnetbuilder\Examples\VSVersion\NET\VarArgExample
    

    MATLAB コマンド プロンプトで、作業フォルダー内の新しい VarArgExample\VarArgComp サブフォルダーに移動します。

  2. 関数 drawgraph および extractcoords を確認します。

    function [xyCoords] = DrawGraph(colorSpec, varargin)
    
        numVarArgIn= length(varargin);
        xyCoords= zeros(numVarArgIn, 2);
    
        for idx = 1:numVarArgIn
            xCoord = varargin{idx}(1);
            yCoord = varargin{idx}(2);
            
            x(idx) = xCoord;
            y(idx) = yCoord;
            
            xyCoords(idx,1) = xCoord;
            xyCoords(idx,2) = yCoord;
        end
        
        xmin = min(0, min(x));
        ymin = min(0, min(y));
    
        axis([xmin fix(max(x))+3 ymin fix(max(y))+3])
        
        plot(x, y, 'color', colorSpec);


    function [varargout] = ExtractCoords(coords)
    
        for idx = 1:nargout
            varargout{idx}= coords(idx,:);
        end
    

  3. 次の情報を使用して、.NET アセンブリ コンパイラ アプリまたは compiler.build.dotNETAssembly で .NET コンポーネントをビルドします。

    フィールド値
    ライブラリ名VarArgComp
    クラス名Plotter
    コンパイル対象ファイルextractcoords.m drawgraph.m

    たとえば、compiler.build.dotNETAssembly を使用している場合は、以下を入力します。

    buildResults = compiler.build.dotNETAssembly(["extractcoords.m","drawgraph.m"], ...
    'AssemblyName','VarArgComp', ...
    'ClassName','Plotter');

    詳細については、MWArray .NET アセンブリの生成と .NET アプリケーションのビルドの手順を参照してください。

  4. コンポーネントにアクセスするために C# または Visual Basic のどちらを使用するのかを決定します。

    • C#

      C# を使用する場合は、コンポーネントにアクセスする C# アプリケーションのソース コードを作成します。

      この例のサンプル アプリケーションは VarArgExample\VarArgCSApp\VarArgApp.cs にあります。

      using System;
      
      using MathWorks.MATLAB.NET.Utility;
      using MathWorks.MATLAB.NET.Arrays;
      
      using VarArgComp;
      
      
      namespace MathWorks.Examples.VarArgApp
       {
        /// <summary>
        /// This application demonstrates how to call components 
        ///  having methods with varargin/vargout arguments.
        /// </summary>
        class VarArgApp
          {
            #region MAIN
      
            /// <summary>
            /// The main entry point for the application.
            /// </summary>
            [STAThread]
            static void Main(string[] args)
              {
                // Initialize the input data
                MWNumericArray colorSpec= new double[]
                                              {0.9, 0.0, 0.0};
                MWNumericArray data= 
                        new MWNumericArray(new int[,]{{1,2},{2,4},
                                             {3,6},{4,8},{5,10}});  
                MWArray[] coords= null;
      
                try
                  {
                    // Create a new plotter object
                    Plotter plotter= new Plotter();
      
                    //Extract a variable number of two element x and y coordinate 
                    //  vectors from the data array
                    coords= plotter.extractcoords(5, data);
      
                    // Draw a graph using the specified color to connect the 
                    //   variable number of input coordinates.
                    // Return a two column data array containing the input coordinates.
                    data= (MWNumericArray)plotter.drawgraph(colorSpec, 
                      coords[0], coords[1], coords[2],coords[3], coords[4]);
      
                    Console.WriteLine("result=\n{0}", data);
      
                    Console.ReadLine();  // Wait for user to exit application
      
                    // Note: You can also pass in the coordinate array directly.
                    data= (MWNumericArray)plotter.drawgraph(colorSpec, coords);
      
                    Console.WriteLine("result=\n{0}", data); 
       
                    Console.ReadLine();  // Wait for user to exit application
                  }
      
                catch(Exception exception)
                  {
                    Console.WriteLine("Error: {0}", exception);
                  }
              }
      
            #endregion
          }
        }
      

      以下のステートメントは、drawgraph メソッドを呼び出す代替方法です。

      data= (MWNumericArray)plotter.drawgraph(colorSpec, 
                      coords[0], coords[1], coords[2],coords[3], coords[4]);
      ...
      data= (MWNumericArray)plotter.drawgraph((MWArray)colorSpec, coords);
      
    • Visual Basic

      Visual Basic を使用する場合は、コンポーネントにアクセスする Visual Basic アプリケーションのソース コードを作成します。

      この例のサンプル アプリケーションは VarArgExample\VarArgVBApp\VarArgApp.vb にあります。

      Imports System
      
      Imports MathWorks.MATLAB.NET.Utility
      Imports MathWorks.MATLAB.NET.Arrays
      
      Imports VarArgComp
      
      
      Namespace MathWorks.Demo.VarArgDemoApp
      
      
      ' <summary>
      ' This application demonstrates how to call components having methods with 
      '   varargin/vargout arguments.
      ' </summary>
      Class VarArgDemoApp
          
      #Region " MAIN "
      
              ' <summary>
              ' The main entry point for the application.
              ' </summary>
              Shared Sub Main(ByVal args() As String)
      
                  ' Initialize the input data
                  Dim colorSpec As MWNumericArray = 
                    New MWNumericArray(New Double() {0.9, 0.0, 0.0})
                  Dim data As MWNumericArray = 
                    New MWNumericArray(New Integer(,) {{1, 2}, {2, 4}, {3, 6}, {4, 8}, {5, 10}})
                  Dim coords() As MWArray = Nothing
      
                  Try
      
                      ' Create a new plotter object
                      Dim plotter As Plotter = New Plotter
      
                      'Extract a variable number of two element x and y coordinate 
                      ' vectors from the data array
                      coords = plotter.extractcoords(5, data)
      
                      ' Draw a graph using the specified color to connect the variable number of 
                      '  input coordinates.
                      ' Return a two column data array containing the input coordinates.
                      data = CType(plotter.drawgraph(colorSpec, coords(0), coords(1), coords(2), 
                         coords(3), coords(4)), _
                                   MWNumericArray)
      
                      Console.WriteLine("result={0}{1}", Chr(10), data)
      
                      Console.ReadLine()  ' Wait for user to exit application
      
                      ' Note: You can also pass in the coordinate array directly.
                      data = CType(plotter.drawgraph(colorSpec, coords), MWNumericArray)
      
                      Console.WriteLine("result=\{0}{1}", Chr(10), data)
      
                      Console.ReadLine()  ' Wait for user to exit application
      
      
                  Catch exception As Exception
                      Console.WriteLine("Error: {0}", exception)
                  End Try
              End Sub
      #End Region
      
          End Class
      End Namespace
      

      以下のステートメントは、drawgraph メソッドを呼び出す代替方法です。

      data = CType(plotter.drawgraph(colorSpec, coords(0), coords(1), coords(2), 
             coords(3), coords(4)), MWNumericArray)
      ...
      data = CType(plotter.drawgraph(colorSpec, coords), MWNumericArray)

    いずれの場合も、VarArgApp プログラムにより次が実行されます。

    • MWArray クラス ライブラリを使用して 3 つの配列 (colorSpec、data、および coords) を初期化する

    • Plotter オブジェクトを作成する

    • extracoords メソッドおよび drawgraph メソッドを呼び出す

    • MWNumericArray を使用して、メソッドで必要なデータを表す

    • try-catch ブロックを使用して例外をキャッチして処理する

  5. Visual Studio を使用して、ご使用のアプリケーション言語に対応した .NET プロジェクト ファイルを開きます。

    • C#

      C# を使用する場合は、VarArgCSApp フォルダーにこの例の Visual Studio .NET プロジェクト ファイルが含まれています。Windows® エクスプローラーで VarArgCSApp.csproj をダブルクリックして、Visual Studio .NET でプロジェクトを開きます。[VarArgCSApp.csproj] を右クリックし、[MATLAB の外部で開く] を選択して、デスクトップから開くこともできます。

    • Visual Basic

      Visual Basic を使用する場合は、VarArgVBApp フォルダーにこの例の Visual Studio .NET プロジェクト ファイルが含まれています。Windows エクスプローラーで VarArgVBApp.vbproj をダブルクリックして、Visual Studio .NET でプロジェクトを開きます。[VarArgVBApp.vbproj] を右クリックし、[MATLAB の外部で開く] を選択して、デスクトップから開くこともできます。

  6. アセンブリを生成またはインストールしたフォルダーにあるアセンブリ ファイル VarArgComp.dll への参照を作成します。

  7. MWArray API への参照を作成します。

    MATLAB がシステムにインストールされている場合matlabroot\toolbox\dotnetbuilder\bin\win64\<framework_version>\MWArray.dll
    MATLAB Runtime がシステムにインストールされている場合<MATLAB_RUNTIME_INSTALL_DIR>\toolbox\dotnetbuilder\bin\win64\<framework_version>\MWArray.dll

  8. Visual Studio .NET で VarArgApp アプリケーションをビルドして実行します。

    プログラムにより、次の出力が表示されます。

    result=
         1     2
         2     4
         3     6
         4     8
         5    10
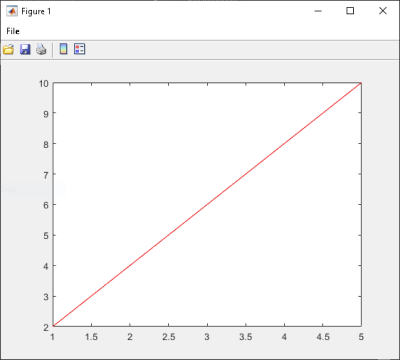
    
    A figure that displays the line created by the coordinates {1, 2}, {2, 4}, {3, 6}, {4, 8}, and {5, 10}.

参考

トピック