getBandedgeFrequencies
Get filter bandedges
Syntax
Description
[
returns the center frequencies of the filters designed by bandEdges,centerFrequencies] = getBandedgeFrequencies(obj)obj.
Examples
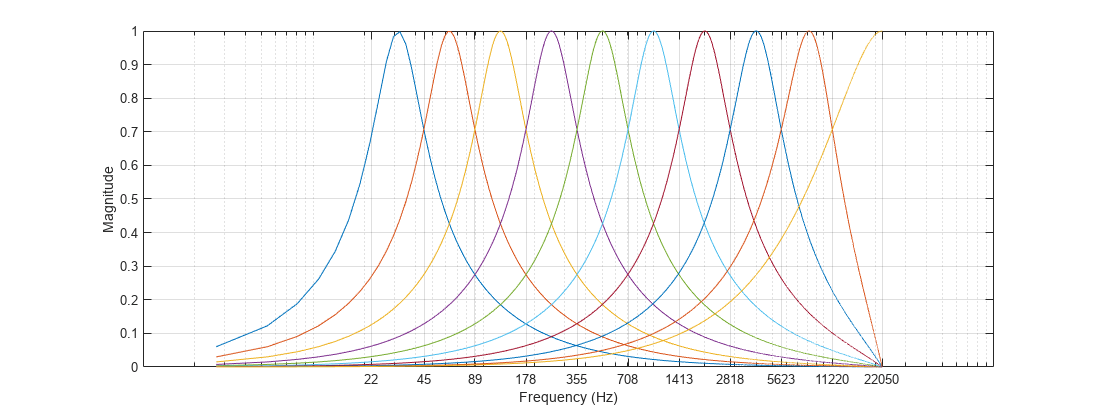
Create a default octaveFilterBank object.
octFiltBank = octaveFilterBank;
Call getBandedgeFrequencies to return a vector of bandedge frequencies.
bE = getBandedgeFrequencies(octFiltBank)
bE = 1×11
104 ×

    0.0022    0.0045    0.0089    0.0178    0.0355    0.0708    0.1413    0.2818    0.5623    1.1220    2.2050
Call freqz to get the frequency response of the filter bank. Plot the magnitude frequency response. Use the bandedge frequencies to label the frequency axis.
[H,f] = freqz(octFiltBank);
semilogx(f,abs(H))
xticks(round(bE))
xlabel('Frequency (Hz)')
ylabel('Magnitude')
grid on
h = gcf;
set(h,'Position',[h.Position(1) h.Position(2) h.Position(3)*2 h.Position(4)])
Input Arguments
Output Arguments
Version History
Introduced in R2019a