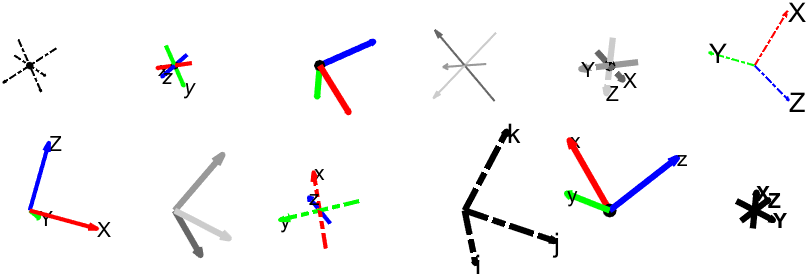
plotframe: Plot a 3-D Cartesian coordinate system
hg = plotframe( rotationMatrix, translationVector, basisVectorLengths, Name=Value )

現在この提出コンテンツをフォロー中です。
- フォローしているコンテンツ フィードに更新が表示されます。
- コミュニケーション基本設定に応じて電子メールを受け取ることができます
引用
George Abrahams (2023) (https://www.linkedin.com/in/georgeabrahams). plotframe: Plot a 3-D Cartesian coordinate system (https://github.com/WD40andTape/plotframe/releases/tag/1.0.0), GitHub. Retrieved December 14, 2023.
一般的な情報
- バージョン (664 KB)
-
 GitHub でライセンスを表示
MATLAB リリースの互換性
- R2020b 以降のリリースと互換性あり
プラットフォームの互換性
- Windows
- macOS
- Linux
| バージョン | 公開済み | リリース ノート | Action |
|---|---|---|---|
| 1.0.2 | See release notes for this release on GitHub: https://github.com/WD40andTape/plotframe/releases/tag/1.0.2 |
||
| 1.0.1 | See release notes for this release on GitHub: https://github.com/WD40andTape/plotframe/releases/tag/1.0.1 |
||
| 1.0.0 |
この GitHub アドオンでの問題を表示または報告するには、GitHub リポジトリにアクセスしてください。
この GitHub アドオンでの問題を表示または報告するには、GitHub リポジトリにアクセスしてください。

