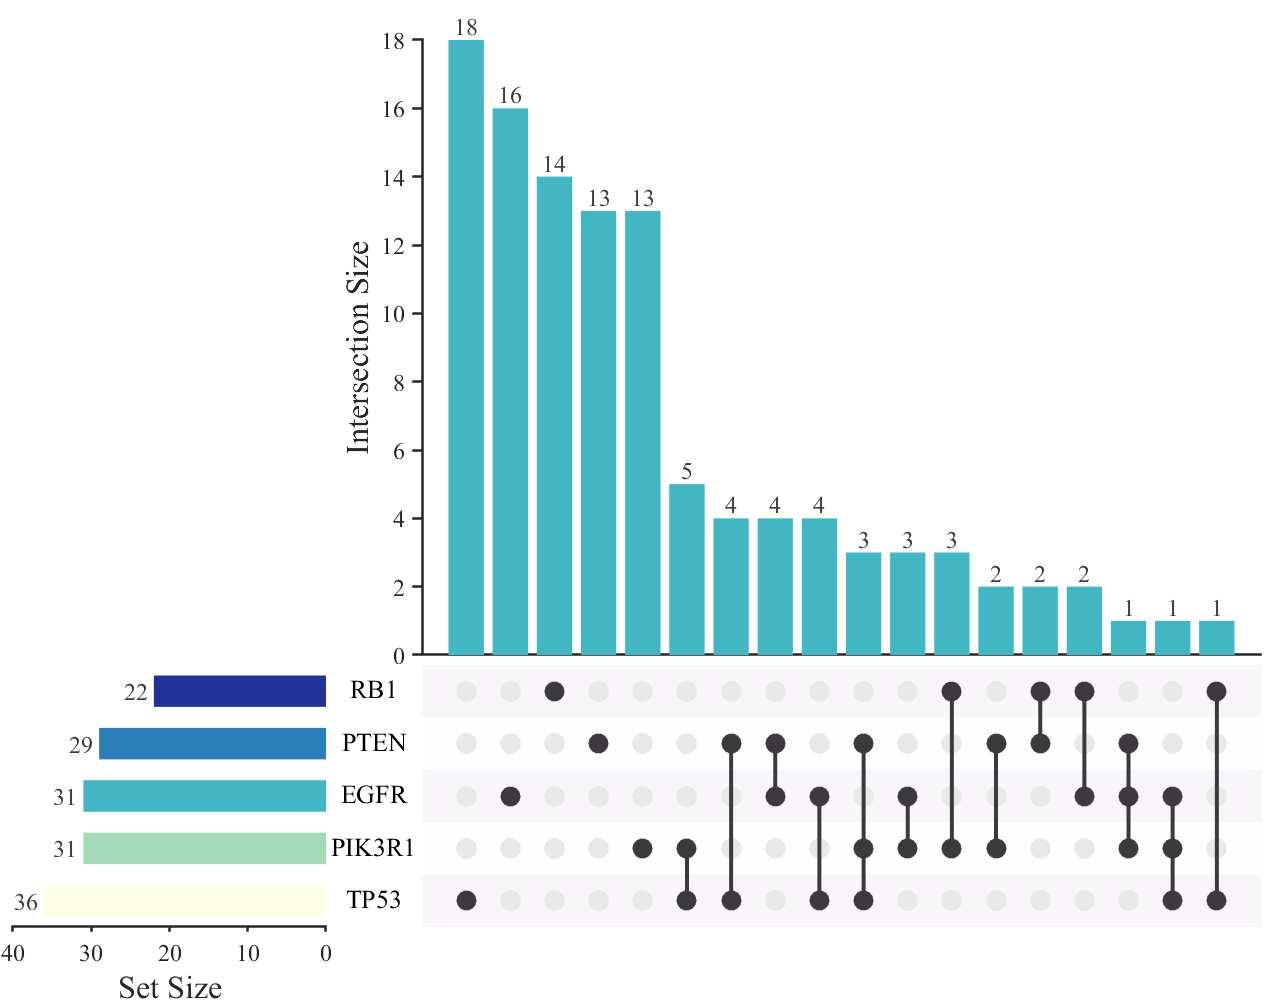
UpSet plot
Draw UpSet plot to show set data with more than three Intersections. Supports both 'intersect' and 'distinct' modes and large-scale dataset.

現在この提出コンテンツをフォロー中です。
- フォローしているコンテンツ フィードに更新が表示されます。
- コミュニケーション基本設定に応じて電子メールを受け取ることができます
引用
Zhaoxu Liu / slandarer (2026). UpSet plot (https://jp.mathworks.com/matlabcentral/fileexchange/123695-upset-plot), MATLAB Central File Exchange. に取得済み.
| バージョン | 公開済み | リリース ノート | Action |
|---|---|---|---|
| 3.0.0 | More controllable layout and additional sorting options. |
||
| 2.2.1 | debug. |
||
| 2.2.0 | Optimized variable and graphics object name display. |
||
| 2.1.0 | More Customization Options
|
||
| 2.0.0 | Supports both 'intersect' and 'distinct' modes and large-scale dataset. |
||
| 1.1.0 | change some base sets |
||
| 1.0.0 |

