Create and Integrate Custom Rate Control Algorithm into WLAN Simulation
Rate control enables devices to adapt to fluctuating channel conditions and dynamically select the optimal data transmission rate. This capability enhances network performance by reducing the probability of errors and retransmissions, thereby optimizing overall network throughput. With WLAN Toolbox™, you can define and implement custom rate control algorithms tailored to your specific simulation requirements. This example demonstrates how to create a custom rate control class from the wlanRateControl base class, and how to integrate it into your WLAN simulation to dynamically adapt transmission rates.
Implement Custom Rate Control Algorithm
To implement a custom rate control algorithm using the wlanRateControl base class of WLAN Toolbox™, follow these steps:
Inherit from the
wlanRateControlbase class. The class definition must have this format, wherecustomRateControlis the name of your custom rate control class.
 classdef customRateControl < wlanRateControl
   ...
 end
Implement the
CustomContextTemplateproperty to define custom contextual information for each receiver. TheCustomContextfield in each structure of theSTAContextproperty contains the value defined by theCustomContextTemplateproperty.Override the
selectRateParametersandprocessTransmissionStatusmethods. Use the available methodsdeviceConfigurationValue,deviceConfigurationType,bssConfigurationValue,maxMCS,maxNumSpaceTimeStreams, andmapReceiverToSTAContextto access configuration data, check receiver capabilities, and map receiver identifiers when implementing rate selection in your subclass.Save the class definition in an
.mfile.In a simulation script, create an object of the custom
RateControlclass. Plug this custom rate control object into a WLAN node through theRateControlproperty of thewlanLinkConfigobject orwlanDeviceConfigobject.
This example implements a custom rate control algorithm based on consecutive transmission success or failures. The model is attached to this example as a supporting file. For more information on the implementation of the model, see Supporting Files.
Simulate WLAN with Custom Rate Control Algorithm
Create the network simulator.
networksimulator = wirelessNetworkSimulator.init;
Create a custom rate control object with a success threshold of 5, a failure threshold of 2, and logging enabled using the customRateControl helper object.
myRC = customRateControl(SuccessThreshold=5,FailureThreshold=2,EnableLogging=true);
Create the device configuration for the AP node, and add the custom rate control algorithm.
deviceCfg = wlanDeviceConfig(Mode="AP",BeaconInterval=5,RateControl=myRC);Create an AP node with the custom device configuration.
apNode = wlanNode(Name="AP",Position=[0 10 0],DeviceConfig=deviceCfg);Create an STA node with default configuration.
staNode = wlanNode(Name="STA",Position=[5 0 0]);
Add mobility to the STA node.
addMobility(staNode,BoundaryShape="circle",Bounds=[5 0 60]);Associate the STA node with the AP node.
associateStations(apNode,staNode)
Configure the network On-Off traffic.
traffic = networkTrafficOnOff(DataRate=10,PacketSize=10,OnExponentialMean=1.3);
addTrafficSource(apNode,traffic,DestinationNode=staNode)
Add the nodes to the simulator.
addNodes(networksimulator,{apNode staNode})Run the simulation for 0.4 seconds.
simulationTime =0.4;
run(networksimulator,simulationTime)
Plot the rate change history.
actualRC = apNode.DeviceConfig.RateControl;
actualRC.plotRateHistory()
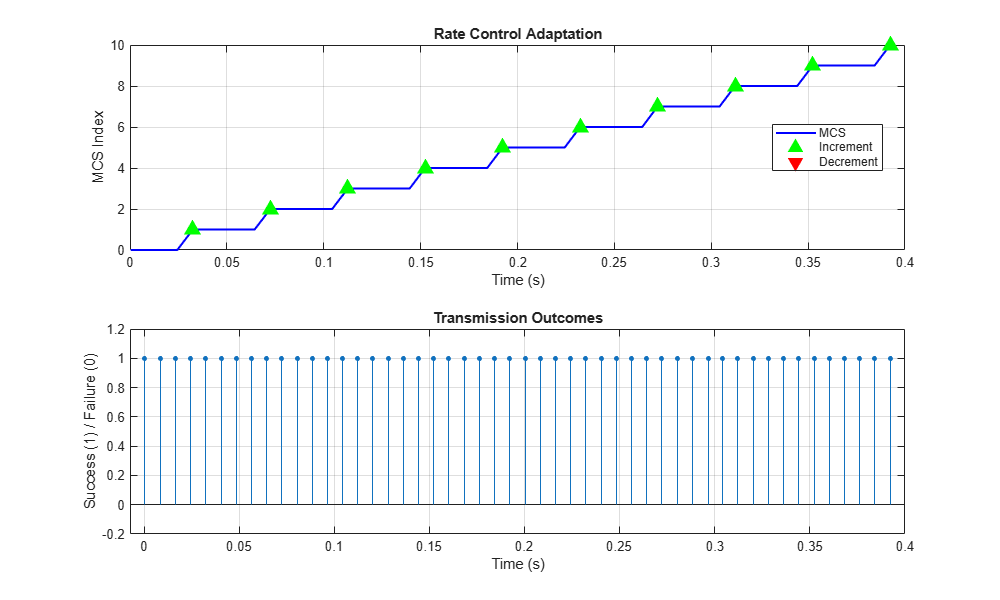
The first figure demonstrates that the rate control algorithm is conservative in increasing the rate (requiring five successes). The transmission outcome plot confirms this pattern, showing clusters of successes leading to MCS increases.
Supporting File
customRateControl.m — Implements a custom rate control algorithm.
classdef customRateControl < wlanRateControl
    % customRateControl
    % Example threshold-based rate control for WLAN simulation.
    % Increases or decreases the data rate (MCS) based on consecutive
    % transmission successes or failures, and logs the rate adaptation process.

    properties
        % Number of consecutive successes before increasing MCS
        SuccessThreshold(1,1) {mustBeNumeric,mustBePositive,mustBeInteger} = 5;

        % Number of consecutive failures before decreasing MCS
        FailureThreshold(1,1) {mustBeNumeric,mustBePositive,mustBeInteger} = 2;

        % If true, logs details of every transmission
        EnableLogging(1,1) logical = true;
    end

    properties (SetAccess = private)
        % Structure array logging details of each transmission
        TransmissionLog = struct("Time",{},"StationID",{},"MCS",{}, ...
            "Success",{},"Action",{});
    end

    properties (Access = protected)
        % Template for station-specific context/state
        CustomContextTemplate = struct( ...
            "CurrentMCS",0, ...
            "SuccessCount",0, ...
            "FailureCount",0);
    end

    methods
        function rateControlAlg = customRateControl(varargin)
            % Constructor: Pass any arguments to base class constructor
            rateControlAlg@wlanRateControl(varargin{:})
        end

        function rateParams = selectRateParameters(rateControlAlg,txContext)
            % selectRateParameters: Selects MCS and spatial streams for transmission
            %   txContext: Structure with transmission context info

            % Map receiver node ID to station index in context
            staIdx = mapReceiverToSTAContext(rateControlAlg,txContext.ReceiverNodeID);

            % Apply rate control to only QoS Data frames
            if strcmp(txContext.FrameType,"QoS Data")
                % Use current MCS for this station, as tracked in context
                mcs = rateControlAlg.STAContext(staIdx).CustomContext.CurrentMCS;
                % Get the number of space-time streams from device configuration
                nsts = deviceConfigurationValue(rateControlAlg,"NumSpaceTimeStreams");
            else
                % For management/control frames, use default values
                mcs = 0;
                nsts = 1;
            end

            % Return selected rate parameters
            rateParams.MCS = mcs;
            rateParams.NumSpaceTimeStreams = nsts;
        end

        function processTransmissionStatus(rateControlAlg,txContext,txStatusInfo)
            % processTransmissionStatus: Updates rate control state after a transmission
            %   txContext: Information about the transmitted frame
            %   txStatusInfo: Information about the transmission outcome

            % Only process QoS Data frames for rate adaptation
            if ~strcmp(txContext.FrameType,"QoS Data")
                return;
            end

            % Map receiver node ID to station index in context
            staIdx = mapReceiverToSTAContext(rateControlAlg,txContext.ReceiverNodeID);

            % Determine if the transmission failed
            isFail = ~txStatusInfo.IsMPDUSuccess;
            if isscalar(isFail)
                failed = isFail;
            else
                % If multiple MPDUs, majority failure determines outcome
                failed = nnz(isFail) > nnz(~isFail);
            end

            % Retrieve current context/state for this station
            ctx = rateControlAlg.STAContext(staIdx).CustomContext;
            action = "MAINTAIN"; % Default action

            % Directly call the maxMCS method of the base class
            % This ensures we do not exceed the maximum allowed MCS for:
            % - the capability of the receiver
            % - the transmission format (such as VHT, HE, EHT)
            % - the number of space-time streams (NSTS)
            % - the channel bandwidth
            % Always use maxMCS to stay within PHY and device constraints
            receiverID = rateControlAlg.STAContext(staIdx).ReceiverID;
            format = txContext.TransmissionFormat;
            nsts = deviceConfigurationValue(rateControlAlg,"NumSpaceTimeStreams");
            bw = txContext.ChannelBandwidth;
            maxMCSValue = maxMCS(rateControlAlg,receiverID,format,nsts,bw);

            % Rate adaptation logic based on success/failure history
            if failed
                % Increment failure count and reset success count
                ctx.FailureCount = ctx.FailureCount + 1;
                ctx.SuccessCount = 0;

                % If failures exceed threshold, decrease MCS (if possible)
                if ctx.FailureCount >= rateControlAlg.FailureThreshold
                    if ctx.CurrentMCS > 0
                        ctx.CurrentMCS = ctx.CurrentMCS - 1;
                        action = "DECREMENT";
                    end
                    ctx.FailureCount = 0; % Reset failure count
                end
            else
                % Increment success count and reset failure count
                ctx.SuccessCount = ctx.SuccessCount + 1;
                ctx.FailureCount = 0;

                % If successes exceed threshold, increase MCS (if possible)
                if ctx.SuccessCount >= rateControlAlg.SuccessThreshold
                    % Use maxMCSValue to ensure we do not exceed allowed MCS
                    if ctx.CurrentMCS < maxMCSValue
                        ctx.CurrentMCS = ctx.CurrentMCS + 1;
                        action = "INCREMENT";
                    end
                    ctx.SuccessCount = 0; % Reset success count
                end
            end

            % Log transmission outcome if logging is enabled
            if rateControlAlg.EnableLogging
                logEntry.Time = txStatusInfo.CurrentTime;
                logEntry.StationID = txContext.ReceiverNodeID;
                logEntry.MCS = ctx.CurrentMCS;
                logEntry.Success = ~failed;
                logEntry.Action = action;
                rateControlAlg.TransmissionLog(end+1) = logEntry;
            end

            % Update the station context with new state
            rateControlAlg.STAContext(staIdx).CustomContext = ctx;
        end

        function plotRateHistory(rateControlAlg)
            % plotRateHistory: Visualize MCS changes and transmission outcomes

            if isempty(rateControlAlg.TransmissionLog)
                warning("No transmission data logged")
                return
            end

            times = [rateControlAlg.TransmissionLog.Time];
            mcsValues = [rateControlAlg.TransmissionLog.MCS];
            successes = [rateControlAlg.TransmissionLog.Success];

            figure("Position",[100 100 1000 600])

            % Plot MCS (data rate) over time
            subplot(2,1,1)
            hMCS = plot(times,mcsValues,"b-",LineWidth=1.5);
            hold on

            % Mark points where MCS was incremented or decremented
            hInc = []; % handle for increment
            hDec = []; % handle for decrement
            for i = 2:length(rateControlAlg.TransmissionLog)
                if strcmp(rateControlAlg.TransmissionLog(i).Action,"INCREMENT")
                    h = plot(times(i),mcsValues(i),"g^",MarkerSize=10, ...
                        MarkerFaceColor="g");
                    if isempty(hInc)
                        hInc = h; % store handle for legend
                    end
                elseif strcmp(rateControlAlg.TransmissionLog(i).Action,"DECREMENT")
                    h = plot(times(i),mcsValues(i),"rv",MarkerSize=10, ...
                        MarkerFaceColor="r");
                    if isempty(hDec)
                        hDec = h; % store handle for legend
                    end
                end
            end

            % If no increment/decrement events, create dummy markers for legend
            if isempty(hInc)
                hInc = plot(nan,nan,"g^",MarkerSize=10,MarkerFaceColor="g");
            end
            if isempty(hDec)
                hDec = plot(nan,nan,"rv",MarkerSize=10,MarkerFaceColor="r");
            end

            grid on;
            xlabel("Time (s)");
            ylabel("MCS Index");
            title("Rate Control Adaptation");
            legend([hMCS,hInc,hDec],{"MCS","Increment","Decrement"},Location="best");

            % Plot transmission outcomes (success/failure) over time
            subplot(2,1,2);
            stem(times,successes,"filled",MarkerSize=3);
            grid on;
            xlabel("Time (s)");
            ylabel("Success (1) / Failure (0)");
            title("Transmission Outcomes");
            ylim([-0.2 1.2]);
        end
    end
end