このページの内容は最新ではありません。最新版の英語を参照するには、ここをクリックします。
rcoplot
残差事例順プロット
構文
rcoplot(r,rint)

rcoplot(ax,r,rint)
説明
rcoplot(r,rint) は、回帰からの残差に信頼区間の誤差範囲プロットを表示します。残差は、事例順にプロットに示されます。
rcoplot(ax,r,rint) は、現在の座標軸 (gca) ではなく ax によって指定される座標軸にプロットします。 (R2024a 以降)
例
rcoplot 関数を使用して、残差事例順プロットをプロットします。このタイプのプロットは外れ値の識別に役立ちます。
5 つの予測子に基づく生物化学的酸素要求量が格納された moore データ セットを読み込みます。
load mooreregress 関数を使用して、線形加法回帰モデルをデータに当てはめます。
X = [ones(size(moore,1),1) moore(:,1:5)];
y = moore(:,6);
alpha = 0.05;
[beta,betaInt,residual,residualInt,stats] = regress(y,X,alpha);
モデルから残差と予測区間をプロットします。
rcoplot(residual,residualInt)
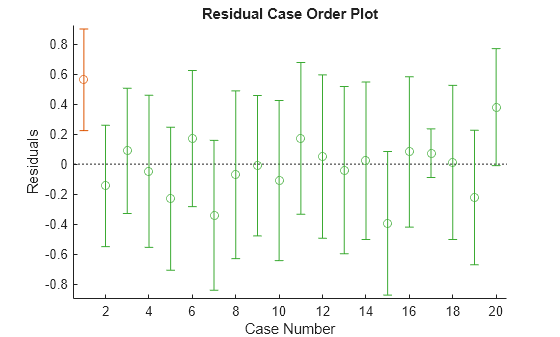
1 番目の残差を含む区間 (赤で表示) には、ゼロが含まれません。この結果は、残差が新しい観測の 95% 内と予想されるよりも大きく、そのデータが外れ値であることを示します。