selectFeatures
Syntax
Description
idx = selectFeatures(mdl,NumFeatures=numfeatures)numfeatures.
idx = selectFeatures(mdl,MaxWeightFraction=maxweightfraction)maxweightfraction.
Examples
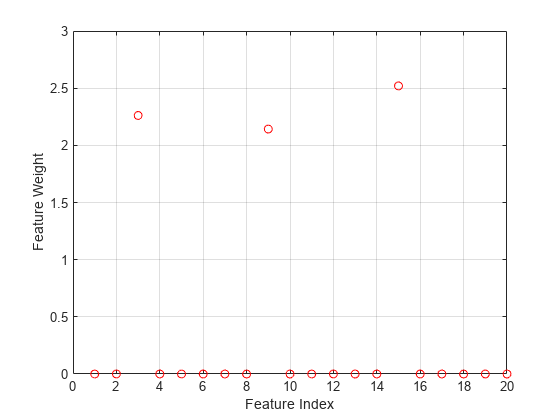
Generate data where the response variable depends on the 3rd, 9th, and 15th predictors.
rng(0,"twister"); % For reproducibility
N = 100;
X = rand(N,20);
y = -ones(N,1);
y(X(:,3).*X(:,9)./X(:,15) < 0.4) = 1;
Fit the NCA model for classification.
mdl = fscnca(X,y,Solver="sgd",Verbose=1); o Tuning initial learning rate: NumTuningIterations = 20, TuningSubsetSize = 100
|===============================================|
| TUNING | TUNING SUBSET | LEARNING |
| ITER | FUN VALUE | RATE |
|===============================================|
| 1 | -3.755936e-01 | 2.000000e-01 |
| 2 | -3.950971e-01 | 4.000000e-01 |
| 3 | -4.311848e-01 | 8.000000e-01 |
| 4 | -4.903195e-01 | 1.600000e+00 |
| 5 | -5.630190e-01 | 3.200000e+00 |
| 6 | -6.166993e-01 | 6.400000e+00 |
| 7 | -6.255669e-01 | 1.280000e+01 |
| 8 | -6.255669e-01 | 1.280000e+01 |
| 9 | -6.255669e-01 | 1.280000e+01 |
| 10 | -6.255669e-01 | 1.280000e+01 |
| 11 | -6.255669e-01 | 1.280000e+01 |
| 12 | -6.255669e-01 | 1.280000e+01 |
| 13 | -6.255669e-01 | 1.280000e+01 |
| 14 | -6.279210e-01 | 2.560000e+01 |
| 15 | -6.279210e-01 | 2.560000e+01 |
| 16 | -6.279210e-01 | 2.560000e+01 |
| 17 | -6.279210e-01 | 2.560000e+01 |
| 18 | -6.279210e-01 | 2.560000e+01 |
| 19 | -6.279210e-01 | 2.560000e+01 |
| 20 | -6.279210e-01 | 2.560000e+01 |
o Solver = SGD, MiniBatchSize = 10, PassLimit = 5
|==========================================================================================|
| PASS | ITER | AVG MINIBATCH | AVG MINIBATCH | NORM STEP | LEARNING |
| | | FUN VALUE | NORM GRAD | | RATE |
|==========================================================================================|
| 0 | 9 | -5.658450e-01 | 4.492407e-02 | 9.290605e-01 | 2.560000e+01 |
| 1 | 19 | -6.131382e-01 | 4.923625e-02 | 7.421541e-01 | 1.280000e+01 |
| 2 | 29 | -6.225056e-01 | 3.738784e-02 | 3.277588e-01 | 8.533333e+00 |
| 3 | 39 | -6.233366e-01 | 4.947901e-02 | 5.431133e-01 | 6.400000e+00 |
| 4 | 49 | -6.238576e-01 | 3.445763e-02 | 2.946188e-01 | 5.120000e+00 |
Two norm of the final step = 2.946e-01
Relative two norm of the final step = 6.588e-02, TolX = 1.000e-06
EXIT: Iteration or pass limit reached.
Plot the selected features. The weights of the irrelevant features are close to zero.
figure()
plot(mdl.FeatureWeights,"ro")
grid on
xlabel("Feature Index")
ylabel("Feature Weight")
Sort all predictors according to their feature weights.
idx = selectFeatures(mdl);
mdl.PredictorNames(idx).'
ans = 20×1 cell
    {'x15'}
    {'x3' }
    {'x9' }
    {'x16'}
    {'x10'}
    {'x13'}
    {'x2' }
    {'x18'}
    {'x17'}
    {'x12'}
    {'x14'}
    {'x8' }
    {'x4' }
    {'x11'}
    {'x19'}
    {'x20'}
    {'x6' }
    {'x5' }
    {'x7' }
    {'x1' }
mdl.FeatureWeights(idx)
ans = 20×1

    2.5197
    2.2613
    2.1424
    0.0000
    0.0000
    0.0000
    0.0000
    0.0000
    0.0000
    0.0000
    0.0000
    0.0000
    0.0000
    0.0000
    0.0000
      ⋮
Select five predictors with the largest feature weights.
idx = selectFeatures(mdl,NumFeatures=5);
mdl.PredictorNames(idx).'
ans = 5×1 cell
    {'x15'}
    {'x3' }
    {'x9' }
    {'x16'}
    {'x10'}
Select predictors with feature weights greater than or equal to the threshold defined by maxweightfraction.
idx = selectFeatures(mdl,MaxWeightFraction=0.4);
mdl.PredictorNames(idx).'
ans = 3×1 cell
    {'x15'}
    {'x3' }
    {'x9' }
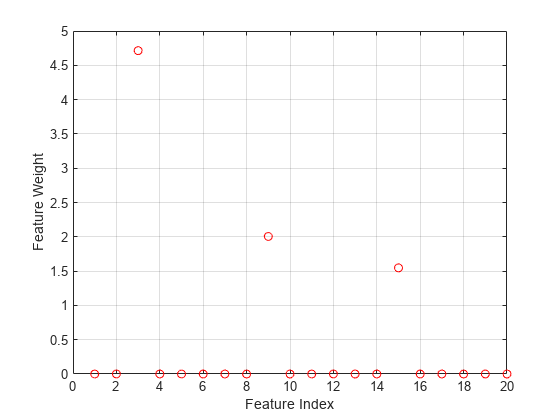
Generate data where the response variable depends on the 3rd, 9th, and 15th predictors.
rng(0,"twister"); % For reproducibility
N = 100;
X = rand(N,20);
y = 1 + X(:,3)*5 + sin(X(:,9)./X(:,15) + 0.25*randn(N,1));
Fit the NCA model for regression.
mdl = fsrnca(X,y,Solver="lbfgs",Verbose=1,Lambda=0.5/N); o Solver = LBFGS, HessianHistorySize = 15, LineSearchMethod = weakwolfe
|====================================================================================================|
| ITER | FUN VALUE | NORM GRAD | NORM STEP | CURV | GAMMA | ALPHA | ACCEPT |
|====================================================================================================|
| 0 | 1.636932e+00 | 3.688e-01 | 0.000e+00 | | 1.627e+00 | 0.000e+00 | YES |
| 1 | 8.304833e-01 | 1.083e-01 | 2.449e+00 | OK | 9.194e+00 | 4.000e+00 | YES |
| 2 | 7.548105e-01 | 1.341e-02 | 1.164e+00 | OK | 1.095e+01 | 1.000e+00 | YES |
| 3 | 7.346997e-01 | 9.752e-03 | 6.383e-01 | OK | 2.979e+01 | 1.000e+00 | YES |
| 4 | 7.053407e-01 | 1.605e-02 | 1.712e+00 | OK | 5.809e+01 | 1.000e+00 | YES |
| 5 | 6.970502e-01 | 9.106e-03 | 8.818e-01 | OK | 6.223e+01 | 1.000e+00 | YES |
| 6 | 6.952347e-01 | 5.522e-03 | 6.382e-01 | OK | 3.280e+01 | 1.000e+00 | YES |
| 7 | 6.946302e-01 | 9.102e-04 | 1.952e-01 | OK | 3.380e+01 | 1.000e+00 | YES |
| 8 | 6.945037e-01 | 6.557e-04 | 9.942e-02 | OK | 8.490e+01 | 1.000e+00 | YES |
| 9 | 6.943908e-01 | 1.997e-04 | 1.756e-01 | OK | 1.124e+02 | 1.000e+00 | YES |
| 10 | 6.943785e-01 | 3.478e-04 | 7.755e-02 | OK | 7.621e+01 | 1.000e+00 | YES |
| 11 | 6.943728e-01 | 1.428e-04 | 3.416e-02 | OK | 3.649e+01 | 1.000e+00 | YES |
| 12 | 6.943711e-01 | 1.128e-04 | 1.231e-02 | OK | 6.092e+01 | 1.000e+00 | YES |
| 13 | 6.943688e-01 | 1.066e-04 | 2.326e-02 | OK | 9.319e+01 | 1.000e+00 | YES |
| 14 | 6.943655e-01 | 9.324e-05 | 4.399e-02 | OK | 1.810e+02 | 1.000e+00 | YES |
| 15 | 6.943603e-01 | 1.206e-04 | 8.823e-02 | OK | 4.609e+02 | 1.000e+00 | YES |
| 16 | 6.943582e-01 | 1.701e-04 | 6.669e-02 | OK | 8.425e+01 | 5.000e-01 | YES |
| 17 | 6.943552e-01 | 5.160e-05 | 6.473e-02 | OK | 8.832e+01 | 1.000e+00 | YES |
| 18 | 6.943546e-01 | 2.477e-05 | 1.215e-02 | OK | 7.925e+01 | 1.000e+00 | YES |
| 19 | 6.943546e-01 | 1.077e-05 | 6.086e-03 | OK | 1.378e+02 | 1.000e+00 | YES |
|====================================================================================================|
| ITER | FUN VALUE | NORM GRAD | NORM STEP | CURV | GAMMA | ALPHA | ACCEPT |
|====================================================================================================|
| 20 | 6.943545e-01 | 2.260e-05 | 4.071e-03 | OK | 5.856e+01 | 1.000e+00 | YES |
| 21 | 6.943545e-01 | 4.250e-06 | 1.109e-03 | OK | 2.964e+01 | 1.000e+00 | YES |
| 22 | 6.943545e-01 | 1.916e-06 | 8.356e-04 | OK | 8.649e+01 | 1.000e+00 | YES |
| 23 | 6.943545e-01 | 1.083e-06 | 5.270e-04 | OK | 1.168e+02 | 1.000e+00 | YES |
| 24 | 6.943545e-01 | 1.791e-06 | 2.673e-04 | OK | 4.016e+01 | 1.000e+00 | YES |
| 25 | 6.943545e-01 | 2.596e-07 | 1.111e-04 | OK | 3.154e+01 | 1.000e+00 | YES |
Infinity norm of the final gradient = 2.596e-07
Two norm of the final step = 1.111e-04, TolX = 1.000e-06
Relative infinity norm of the final gradient = 2.596e-07, TolFun = 1.000e-06
EXIT: Local minimum found.
Plot the selected features. The weights of the irrelevant features are close to zero.
figure;
plot(mdl.FeatureWeights,"ro");
grid on;
xlabel("Feature Index");
ylabel("Feature Weight");
Sort all predictors according to their feature weights.
idx = selectFeatures(mdl);
mdl.PredictorNames(idx).'
ans = 20×1 cell
    {'x3' }
    {'x9' }
    {'x15'}
    {'x8' }
    {'x18'}
    {'x17'}
    {'x13'}
    {'x6' }
    {'x16'}
    {'x5' }
    {'x4' }
    {'x20'}
    {'x10'}
    {'x1' }
    {'x11'}
    {'x2' }
    {'x12'}
    {'x19'}
    {'x7' }
    {'x14'}
mdl.FeatureWeights(idx)
ans = 20×1

    4.7140
    2.0046
    1.5471
    0.0000
    0.0000
    0.0000
    0.0000
    0.0000
    0.0000
    0.0000
    0.0000
    0.0000
    0.0000
    0.0000
    0.0000
      ⋮
Select five predictors with the largest feature weights.
idx = selectFeatures(mdl,NumFeatures=5);
mdl.PredictorNames(idx).'
ans = 5×1 cell
    {'x3' }
    {'x9' }
    {'x15'}
    {'x8' }
    {'x18'}
Select predictors with feature weights greater than or equal to the threshold defined by maxweightfraction.
idx = selectFeatures(mdl,MaxWeightFraction=0.4);
mdl.PredictorNames(idx).'
ans = 2×1 cell
    {'x3'}
    {'x9'}
Input Arguments
Output Arguments
Version History
Introduced in R2023b