混合信号の抽出
この例では、rica を使用して混合オーディオ信号を分離する方法を示します。前置白色化が前処理ステップとして含まれている場合、rica を使用して独立成分分析 (ICA) を行えます。ICA モデルは次のとおりです。
ここで、 は 行 1 列の混合信号のベクトル、 は 行 1 列のオフセット値のベクトル、 は 行 列の混同行列、 は 行 1 列の元の信号のベクトルです。まず、 が正方行列であるとします。 と がわかっている場合は、元の信号 をデータ から復元できます。
関数 rica を使用すると、混同行列 または平均 が不明な場合でも、この復元を実行できます。rica は、与えられた観測値 、、... から元の信号 、、... を抽出します。
データの読み込み
MATLAB® に含まれている 6 つのオーディオ ファイルを読み込みます。各ファイルをトリミングして 10,000 個の標本にします。
files = {'chirp.mat'
        'gong.mat'
        'handel.mat'
        'laughter.mat'
        'splat.mat'
        'train.mat'};
S = zeros(10000,6);
for i = 1:6
    test = load(files{i});
    y = test.y(1:10000,1);
    S(:,i) = y;
end
信号の混合
ランダム混同行列を使用して信号を混合し、ランダム オフセットを追加します。
rng('default') % For reproducibility
mixdata = S*randn(6) + randn(1,6);
元の音声を聞くため、次のコードを実行します。
   for i = 1:6
       disp(i);
       sound(S(:,i));
       pause;
   end
混合した音声を聞くため、次のコードを実行します。
   for i = 1:6
       disp(i);
       sound(mixdata(:,i));
       pause;
   end
信号をプロットします。
figure
tiledlayout(2,6)
for i = 1:6
    nexttile(i)
    plot(S(:,i))
    title(['Sound ',num2str(i)])
    nexttile(i+6)
    plot(mixdata(:,i))
    title(['Mix ',num2str(i)])
end
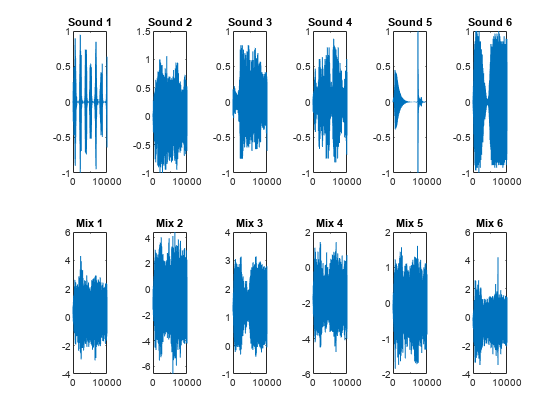
元の信号には明確な構造があります。混合信号にはほとんど構造がありません。
混合信号の前置白色化
信号を効果的に分離するため、この例の終わりにある関数 prewhiten を使用して信号を "事前に白色化" します。この関数は、ゼロ平均と単位共分散をもつように mixdata を変換します。
考え方は以下のとおりです。 がゼロ平均ソースであり、その成分が統計的に独立している場合、次のようになります。
すると、 の平均と共分散は次のようになります。
と は既知であるとします。実際には、標本の平均と の列の共分散からこれらの数量を推定します。次のように、 に関して を解くことができます。
が正方可逆行列ではない場合、後者の方程式は一定になります。
が半正定値行列 の左固有ベクトルによる 行 列の行列であり、 が 行 列の固有値の行列であるとします。また、以下とします。
また、以下とします。
この最後の方程式を満たす混同行列 は複数あります。 が 行 列の正規直交行列である場合、次のようになります。
についての方程式に代入します。
ここで
は事前に白色化されたデータです。rica は、 の成分が可能な限り独立であると仮定して、未知の行列 を計算します。
mixdata = prewhiten(mixdata);
すべての信号の分離
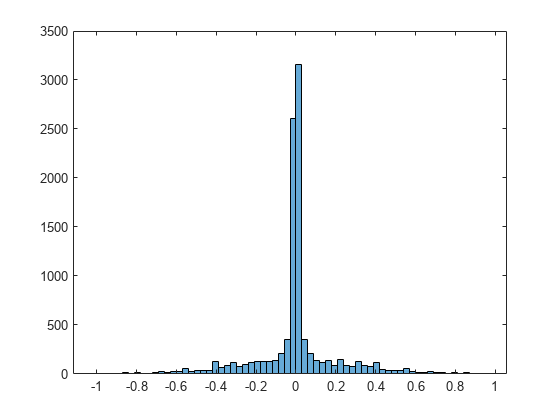
音声 1 のヒストグラムに示されているように、優ガウス性のソースではゼロの付近に鋭いピークがあります。
figure
histogram(S(:,1))
6 つの特徴量を要求して再構成 ICA を実行します。各ソースが優ガウス性であることを指定します。
q = 6;
Mdl = rica(mixdata,q,'NonGaussianityIndicator',ones(6,1));
特徴量を抽出します。分離手順に成功した場合、特徴量は元の信号に比例します。
unmixed = transform(Mdl,mixdata);
分離信号と元の信号の比較
元の信号と分離信号をプロットします。
figure
tiledlayout(2,6)
for i = 1:6
    nexttile(i)
    plot(S(:,i))
    title(['Sound ',num2str(i)])
    nexttile(i+6)
    plot(unmixed(:,i))
    title(['Unmix ',num2str(i)])
end

分離信号の順序は元の順序と異なります。列を並べ替えて、対応する元の信号と分離信号を一致させます。分離信号をスケーリングして、対応する元の信号と同じノルムにします (どのスケールでも同じ信号混合になるので、rica は元の信号のスケールを識別できません)。
unmixed = unmixed(:,[2,5,4,6,3,1]);
for i = 1:6
    unmixed(:,i) = unmixed(:,i)/norm(unmixed(:,i))*norm(S(:,i));
end
元の信号と分離信号をプロットします。
figure
tiledlayout(2,6)
for i = 1:6
    nexttile(i)
    plot(S(:,i))
    ylim([-1,1])
    title(['Sound ',num2str(i)])
    nexttile(i+6)
    plot(unmixed(:,i))
    ylim([-1,1])
    title(['Unmix ',num2str(i)])
end

分離信号は元の信号と同じように見えます。分離した音声を聞くため、次のコードを実行します。
   for i = 1:6
       disp(i);
       sound(unmixed(:,i));
       pause;
   end
以下は、関数 prewhiten のコードです。
function Z = prewhiten(X)
% X = N-by-P matrix for N observations and P predictors
% Z = N-by-P prewhitened matrix

    % 1. Size of X.
    [N,P] = size(X);
    assert(N >= P);

    % 2. SVD of covariance of X. We could also use svd(X) to proceed but N
    % can be large and so we sacrifice some accuracy for speed.
    [U,Sig] = svd(cov(X));
    Sig     = diag(Sig);
    Sig     = Sig(:)';

    % 3. Figure out which values of Sig are non-zero.
    tol = eps(class(X));
    idx = (Sig > max(Sig)*tol);
    assert(~all(idx == 0));

    % 4. Get the non-zero elements of Sig and corresponding columns of U.
    Sig = Sig(idx);
    U   = U(:,idx);

    % 5. Compute prewhitened data.
    mu = mean(X,1);
    Z = X-mu;
    Z = (Z*U)./sqrt(Sig);
end
参考
rica | sparsefilt | ReconstructionICA | SparseFiltering