MATLAB ヘルプ センター
Remove current data and add new data to Smith chart
replace(plot,data)
replace(plot,frequency,data)
replace(plot,data) removes all current data from a Smith chart, plot, and adds new data to the Smith chart.
plot
data
example
replace(plot,frequency,data) removes all current data and adds new data to the Smith chart based on multiple data sets containing frequencies corresponding to columns of the data matrix.
frequency
collapse all
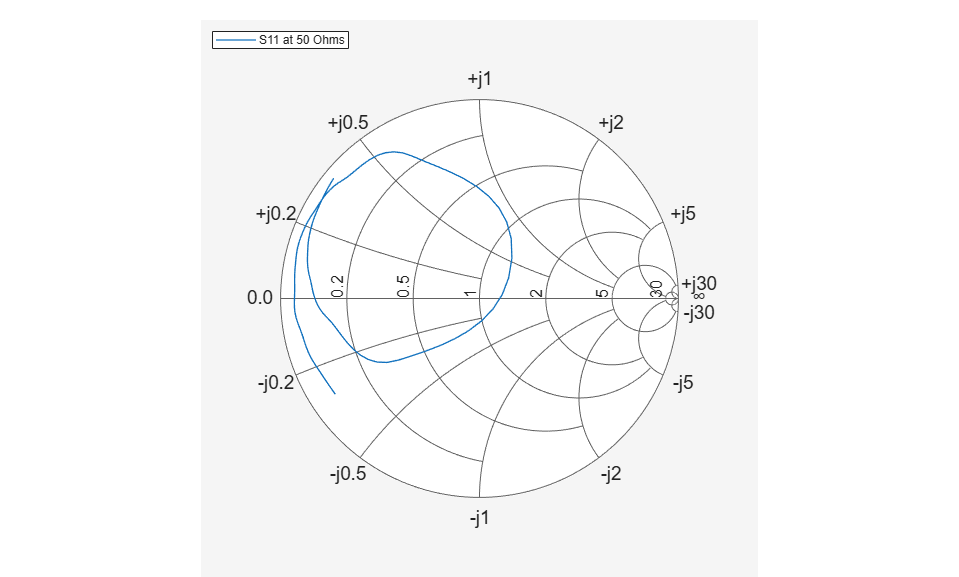
Read S-parameter data.
amp = read(rfckt.amplifier,'default.s2p'); Sa = sparameters(amp); smithplot(Sa,[1,1],'LegendLabels','S11 at 50 Ohms');
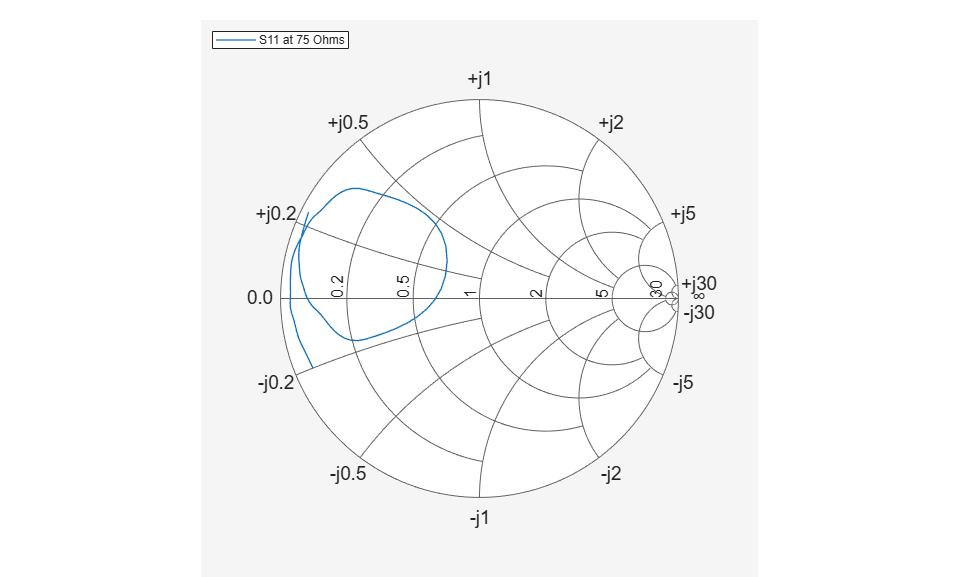
Plot S-parameter object with a new impedance of Z0 = 75 Ohms.
Sa = sparameters(Sa,75); S11 = rfparam(Sa,1,1); Freq = Sa.Frequencies; s = smithplot('gco'); replace(s, Freq, S11); s.LegendLabels = 'S11 at 75 Ohms';
Smith chart handle, specified as a plot handle. If the handle of the Smith chart is not retained during creation, use p = smithplot('gco').
p = smithplot('gco')
Input data, specified as a complex vector or complex matrix.
For a matrix D, the columns of D are independent datasets. For N-by-D arrays, dimensions 2 and greater are independent datasets.
Data Types: double Complex Number Support: Yes
double
Frequency data, specified as a real vector.
Data Types: double
Introduced in R2017b
add | smithplot
add
smithplot
You clicked a link that corresponds to this MATLAB command:
Run the command by entering it in the MATLAB Command Window. Web browsers do not support MATLAB commands.
Web サイトの選択
Web サイトを選択すると、翻訳されたコンテンツにアクセスし、地域のイベントやサービスを確認できます。現在の位置情報に基づき、次のサイトの選択を推奨します:
また、以下のリストから Web サイトを選択することもできます。
最適なサイトパフォーマンスの取得方法
中国のサイト (中国語または英語) を選択することで、最適なサイトパフォーマンスが得られます。その他の国の MathWorks のサイトは、お客様の地域からのアクセスが最適化されていません。
南北アメリカ
ヨーロッパ
アジア太平洋地域
最寄りの営業オフィスへのお問い合わせ