このページの内容は最新ではありません。最新版の英語を参照するには、ここをクリックします。
DCA1000EVM キャプチャ カードの使用による、TI mmWave レーダー ボードからの生 ADC データのリアルタイムでの読み取りおよび処理
この例では、Radar Toolbox Support Package for Texas Instruments® mmWave Radar Sensors を使用して、Texas Instruments (TI) レーダーから生の ADC レーダー データ (IQ データ) を取得し、リアルタイム処理を実行する方法を示します。
さらに、この例には、TI レーダーから収集された ADC データを使用して、レンジ応答とレンジ-ドップラー応答を評価および可視化する方法の説明も含まれています。
必要な製品
MATLAB®
Radar Toolbox Support Package for Texas Instruments mmWave Radar Sensors
サポート パッケージのインストールの詳細については、TI mmWave ハードウェアのサポートのインストールおよびハードウェア セットアップの実行を参照してください。
必要なハードウェア
DCA1000EVM に接続して生の ADC データ (IQ データ) を読み取ることをサポートする、サポートされている TI mmWave レーダー評価モジュール (EVM) の 1 つ (サポートされているボードを参照)
USB ケーブル (Type A-Micro B)
5V、3A 電源アダプター (AWR1642BOOST ボードまたは IWR1642BOOST ボードを使用する場合は、電源アダプターを 2 つ使用することを推奨)
DCA1000EVM キャプチャ カード
Samtec ケーブル
イーサネット ケーブル
ハードウェア セットアップ
ADC データを MATLAB に読み取るには、TI mmWave レーダー センサーと DCA1000EVM を使用する前にセット アップしなければなりません。ハードウェア セットアップ手順を (ハードウェア セットアップ画面で説明されているとおりに) 完了してセンサーをセット アップします。ハードウェア セットアップを起動するには、以下のコマンドを実行し、画面に表示される手順に従います。
mmWaveRadarSetup
ハードウェア セットアップ画面の起動方法については、TI mmWave ハードウェアのサポートのインストールおよびハードウェア セットアップの実行を参照してください。
mmWave レーダーと DCA1000 キャプチャ カードへの接続
ハードウェア セットアップ プロセスが正常に完了したら、ボード名を指定して TI レーダー ボードと DCA1000EVM に接続できます。この例では、IWR6843ISK EVM を使用します。別の EVM を使用している場合は、それに応じてボード名を変更してください。
dca = dca1000("IWR6843ISK");ホスト コンピューターに TI Radar ボードを 1 つだけ接続している場合、MATLAB はシリアル ポートの詳細を自動的に検出します。複数のボードを接続している場合、または MATLAB によってシリアル ポートの詳細が自動的に入力されない場合は、ConfigPort 引数を指定します。以下に例を示します。
dca = dca1000("IWR6843ISK",ConfigPort = "COM3")
お使いのボードに対応する Config ポートを識別するには、Identifying Serial Ports for TI mmWave Radar Connectionを参照してください。
TI レーダーの構成
TI mmWave レーダー ボードを構成するには、シリアル ポートを使用してコマンドのシーケンスをボードに送信しなければなりません。シーケンスには、チャープ プロファイル、サンプル レートなどを指定するコマンドが含まれます。dca1000 オブジェクトの ConfigFile プロパティを使用して、コマンドのシーケンスをボードに送信します。詳細については、Configure Radar Using a Configuration (.cfg) File for Reading Raw ADC (IQ) Dataを参照してください。
この例では、サポート パッケージに付属する既定の構成を使用します。
TI レーダー ボードから取得したライブ レーダー ADC データ (IQ データ) を使用して、レンジ応答とレンジ-ドップラー応答を計算して可視化します。
dca1000 オブジェクトを呼び出すと、TI レーダー ボードから 1 つのレーダー データ キューブが取得されます。この関数呼び出しは、次の次元をもつレーダー データ キューブを返します。(ADC サンプル数)×(Rx チャネル数)×(チャープ数)。
ADC サンプル数、Rx チャネル数、およびチャープ数は、それぞれ dca1000 オブジェクトのプロパティ SamplesPerChirp、NumReceivers、および NumChirps の値です。これらの値は、TI mmWave レーダーを構成するために使用しているコンフィギュレーション (.cfg) ファイルに基づいて設定されます。
メモ: dca1000 オブジェクトへの最初の呼び出しでは構成が実行されます。これには時間がかかる場合があります。dca1000 オブジェクトに対する後続の呼び出しはより高速で、データが利用可能になるとすぐに ADC データが返されます。
以下のスクリプトは、レーダー データ キューブを読み取り、phased.RangeScope を使用して ADC データのレンジ応答をリアルタイムで評価および可視化します。phased.RangeResponse System object™ は、FFT ベースのアルゴリズムを使用して、ファストタイム (レンジ) データに対してレンジ フィルター処理を実行するように構成されています。phased.RangeResponse の plotResponse 関数は、入力データのレンジ応答をプロットするために使用されます。
clear dca
% Create connection to TI Radar board and DCA1000EVM Capture card
dca = dca1000("IWR6843ISK");
% Define a variable to set the sampling rate in Hz for the
% phased.RangeResponse object. Because the dca1000 object provides the
% sampling rate in kHz, convert this rate to Hz.
fs = dca.ADCSampleRate*1e3;
% Define a variable to set the FMCW sweep slope in Hz/s for the
% phased.RangeResponse object. Because the dca1000 object provides the
% sweep slope in GHz/us, convert this sweep slope to Hz/s.
sweepSlope = dca.SweepSlope * 1e12;
% Define a variable to set the number of range samples
nr = dca.SamplesPerChirp;
% Create phased.RangeResponse System object that performs range filtering
% on fast-time (range) data, using an FFT-based algorithm
rangeresp = phased.RangeResponse(RangeMethod = 'FFT',...
                                 RangeFFTLengthSource = 'Property',...
                                 RangeFFTLength = nr, ...
                                 SampleRate = fs, ...
                                 SweepSlope = sweepSlope, ...
                                 ReferenceRangeCentered = false);
% The first call of the dca1000 object may take longer due to the
% configuration of the radar and the DCA1000EVM. To exclude the configuration
% time from the loop's duration, make the first call to the dca1000 object
% before entering the loop.
iqData = dca();
% Specify the duration in seconds for which the loop should run
stopTime = 100;
% Start the stopwatch timer
ts = tic;
% Execute the loop until the stopTime specified is reached
while (toc(ts)<stopTime)
% Capture the ADC data (IQ data) from TI Radar board and DCA1000EVM
iqData = dca();
% Get the data from first receiver antenna
iqData = squeeze(iqData(:,1,:));
% Plot the range response corresponding to the the input signal, iqData.
plotResponse(rangeresp,iqData);
% Update figures
drawnow limitrate;
end

% Stop streaming the data and release the non tunable properties
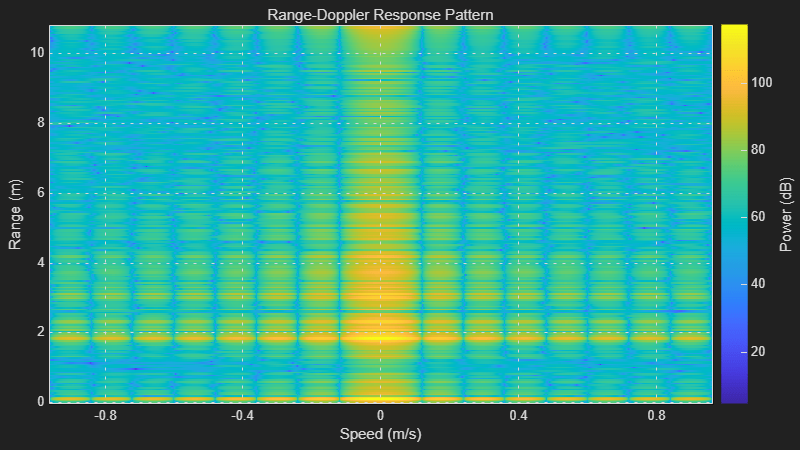
dca.release;以下のスクリプトは、レーダー データ キューブをリアルタイムで読み取り、phased.RangeDopplerScope を使用してレンジ-ドップラー応答マップを計算して表示します。
メモ: 以下のスクリプトの while ループが実行されると、MATLAB Figure ウィンドウが開きます。mmWave レーダーの前面にオブジェクトを移動し、それに応じて Figure が更新されるかどうかを確認できます。
clear dca
% Create connection to TI Radar board and DCA1000EVM Capture card
dca = dca1000("IWR6843ISK");
% Initialize variables
% Define a variable to set the sampling rate in Hz for the
% phased.RangeDopplerScope object. Because the dca1000 object provides the
% sampling rate in kHz, convert this rate to Hz.
fs = dca.ADCSampleRate*1e3;
% Define a variable to set the center frequency in Hz for the
% phased.RangeDopplerScope object. Because the dca1000 object provides the
% center frequency in GHz, convert this rate to Hz.
fc = dca.CenterFrequency*1e9;
% Define a variable to set the pulse repetition period in seconds for the
% phased.RangeDopplerScope object. Because the dca1000 object provides the
% chirp cycle time in us, convert this rate to seconds. The value is
% multiplied by 2 in this example because we are plotting the data only for first
% transmit channel out of 2 channels
tpulse = 2*dca.ChirpCycleTime*1e-6;
% Pulse repetition interval
prf = 1/tpulse;
% Define a variable to set the FMCW sweep slope in Hz/s for the
% phased.RangeResponse object. Because the dca1000 object provides the
% sweep slope in GHz/us, convert this sweep slope to Hz/s.
sweepslope = dca.SweepSlope*1e6/1e-6;
% Samples per chirp or RangeFFTLength
nr = dca.SamplesPerChirp;
% Number of active receivers
nrx = dca.NumReceivers;
% Number of chirps
nchirp = dca.NumChirps;
% Create range doppler scope to compute and display the response map.
rdscope = phased.RangeDopplerScope(IQDataInput=true,...
    SweepSlope = sweepslope,SampleRate = fs,...
    DopplerOutput="Speed",OperatingFrequency=fc,...
    PRFSource="Property",PRF=prf,...
    RangeMethod="FFT",RangeFFTLength=nr, ...
    ReferenceRangeCentered = false);
% The first call of the dca1000 class object may take longer due to the
% configuration of the radar and the DCA1000EVM. To exclude the configuration
% time from the loop's duration, make the first call to the dca1000 object
% before entering the loop.
iqData = dca();
% Specify the duration in seconds for which the loop should run
stopTime  = 150;
ts = tic();
% Execute the loop until the stopTime specified is reached
while (toc(ts)<stopTime)
   % Capture the ADC data (IQ data) from TI Radar board and DCA1000EVM
   iqData = dca();
   % Get the data from first receiver antenna and first transmitter antenna
   % (Every alternate pulse is from one transmitter antenna for this
   % configuration)
   iqData = squeeze(iqData(:,1,1:2:end));
   %  Plot the range doppler response corresponding to the the input signal,
   % iqData.
   rdscope(iqData);
end
% Stop streaming the data and release the non tunable properties
dca.release;