Run Polyspace Test Server and Upload Results for Web-based Review
R2026bPolyspace® Test™ Server™ can be used to run tests and collect code profiling metrics on a server, and then uploads results to a web server for code review.
You can run Polyspace Test Server as part of continuous integration. Set up scripts that run tests at regular intervals or based on new code submissions. The scripts can upload the results for review in the Polyspace Access™ web interface. Reviewers can open the web interface to review only the new test failures or missing coverage from their submission, and then fix or justify the issues.
In a typical project or team, Polyspace Test Server runs periodically on a few testing servers and uploads the results for review. Each developer and quality engineer in the team has a Polyspace Access license to view the results in the web interface for investigation and fixes.
Prerequisites
To run tests and collecting profiling metrics on a server and review the results in the Polyspace Access web interface, perform this one-time setup:
To run tests, install one instance of the Polyspace Test Server product.
To upload results, set up the Polyspace Access server.
To view the uploaded results, each developer reviewing the results must have a Polyspace Access license.
See Install Polyspace Server and Access Products (Polyspace Bug Finder).
Check Polyspace Installation
To check if Polyspace Test Server is installed:
Open a command window. Navigate to
<POLYSPACE_SERVER_ROOT>\polyspace\bin. Here,<POLYSPACE_SERVER_ROOT>is the Polyspace Test Server installation folder, for instance,C:\Program Files\Polyspace Server\R2026b. See also Installation Folder (Polyspace Bug Finder).Enter:
polyspace-test-server -help
You should see the list of actions available with the polyspace-test-server command.
To check if the Polyspace Access web interface is set up for upload:
Navigate again to
<POLYSPACE_SERVER_ROOT>\polyspace\bin.Enter:
polyspace-access -host <HOST_NAME> -port <PORT_NUMBER> -create-project testProjectsHere,
<HOST_NAME>is the name of the Polyspace Access web server. For a locally hosted server, uselocalhost. The<PORT_NUMBER>is the optional port number of the server. If you omit the port number,9443is used.If the setup was complete, a project called
testProjectis created in the Polyspace Access web interface.You are prompted for your login and password each time that you use the
polyspace-accesscommand. To avoid entering login information each time, provide the login and an encrypted version of your password with the command. To create an encrypted password, enter:Enter your login and password. Copy the encrypted password and provide this encrypted password with thepolyspace-access -encrypt-password-encrypted-passwordoption when using thepolyspace-accesscommand.In a web browser, open this URL:
Here,https://<HOST_NAME>:<PORT_NUMBER>/metrics/index.html
<HOST_NAME>and<PORT_NUMBER>are the host name and port number from the previous step.
In the Project Explorer pane on the Polyspace Access web interface, you see the newly created project testProject.
Run Tests on Sample Project
To run tests in a sample project, in your operating system, open a command window.
To run tests, use the
polyspace-test-server -runcommand.To upload the results to the Polyspace Access web interface, use the
polyspace-access -upload(Polyspace Access) command.
To avoid typing the full path to the command, add the path <POLYSPACE_SERVER_ROOT>\polyspace\bin to the Path environment variable on your operating system.
Try out the commands on a sample project provided with your Polyspace installation.
Open a terminal and navigate to a folder where you want to store all generated files including test results. Create two subfolders:
build_artifacts– This folder is used to store artifacts generated from the build.results– This folder is used to store test and code profiling results.
Enter:
polyspace-test-server -run -project <PROJECT_PATH> -results-dir results -build-dir build_artifacts -profiling-mode coverage
polyspace-access -upload results\ps_test.pstestr -parent-project testProjects -host <HOST_NAME> -port <PORT_NUMBER> -login <USER_NAME> -encrypted-password <PWD>
polyspace-access -upload results\ps_coverage.psprof -parent-project testProjects -host <HOST_NAME> -port <PORT_NUMBER> -login <USER_NAME> -encrypted-password <PWD>
Here:
<PROJECT_PATH>is the path to a sample project<POLYSPACE_SERVER_ROOT>\polyspace\examples\pstest\Getting_Started_Example\Demo_C_PS_Test.psprjx.<HOST_NAME>and<PORT_NUMBER>are the host name and port number of the Polyspace Access server.<USER_NAME>is your login name.<PWD>is the encrypted password that you created previously. See Check Polyspace Installation.
Refresh the Polyspace
Access web interface. You see a folder testProject on the Project Explorer pane. The folder contains one entry for test results and another for code profiling results.
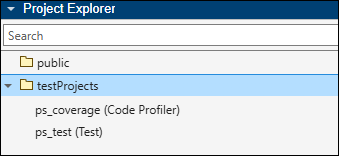
To see the results, with one of ps_coverage or ps_test selected, click Review on the toolstrip.
Review Results and Generate Reports
After you upload test and coverage results, reviewers can open the Polyspace Access web interface to examine test failures and coverage gaps.
To review and justify coverage results:
In a web browser, open the Polyspace Access web interface and navigate to the uploaded project.
Select a coverage result and click Review on the toolstrip to open the result.
Review uncovered items such as uncovered decisions, conditions, or statements. If a coverage gap is acceptable, for instance because the code is defensive or unreachable by design, add a justification with a rationale. Justified items appear with a distinct color in the coverage report and are counted separately from uncovered items. For more information, see .
After you complete the review, you can download the results and generate a report that includes the justifications. To download and generate a report:
Download the results by using the
polyspace-access -download(Polyspace Access) command:polyspace-access -download <RUN_ID> -output-folder-path <DOWNLOAD_DIR> -host <HOST_NAME> -port <PORT_NUMBER> -login <USER_NAME> -encrypted-password <PWD>Use the
polyspace-access -list-projectcommand to find the run ID of the results you want to download.Generate an HTML report from the downloaded results by using the
polyspace-test-server -reportcommand:polyspace-test-server -report -html -report-dir <REPORT_DIR> <DOWNLOAD_DIR>\output_run.psprofThe generated report reflects the justifications added during the review. Justified coverage gaps appear with an aqua background and are counted separately from uncovered items, so that the report accurately represents the reviewed coverage status of your code.
See Also
polyspace-access -upload (Polyspace Access)

