メインコンテンツ

pcclusterprops

R2026b

Calculate properties of 3-D point cloud clusters

Since R2026b

    Description

    clusterProps = pcclusterprops(ptCloud,labels) measures all available properties for each cluster of points identified by labels in the specified point cloud ptCloud.

    example

    clusterProps = pcclusterprops(ptCloud,properties) returns only the set of properties specified by properties.

    Examples

    collapse all

    Load point cloud data that includes scans of trees.

    ld = load("drivingLidarPoints.mat"); 
    ptCloud = ld.ptCloud;

    Segment the point cloud into clusters.

    minDistance = 3;
    [labels,numClusters] = pcsegdist(ptCloud,minDistance);

    Display the point cloud clusters.

    figure
    pcshow(ptCloud.Location,labels)
    colormap(hsv(numClusters))
    title("Point Cloud Clusters")
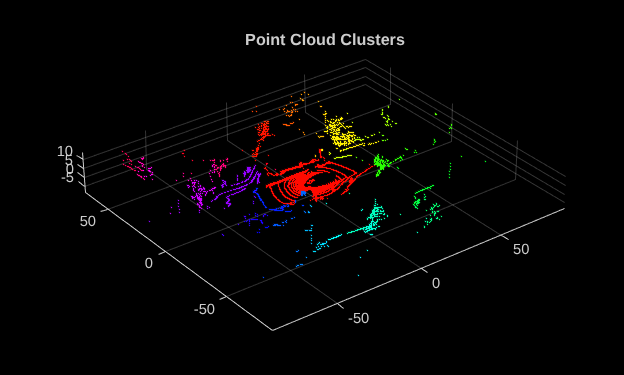
    Figure contains an axes object. The axes object with title Point Cloud Clusters contains an object of type scatter.

    Extract point cloud properties from each cluster.

    clusterprops = pcclusterprops(ptCloud,labels);

    Extract the convex volume of each cluster.

    convexVolumes = [clusterprops.ConvexVolume];

    Select clusters based on a convex volume range.

    minVolume = 6;
    maxVolume = 200;
    
    logicalIdx = (convexVolumes > minVolume) & (convexVolumes < maxVolume);

    Get the labels of selected clusters.

    allLabelsList = [clusterprops.Label];
    labelsToKeep  = allLabelsList(logicalIdx);

    Create a logical mask for the selected clusters.

    labelsLogicalMask = ismember(labels,labelsToKeep);

    Extract the selected clusters from point cloud.

    trimmedPtCloud = ptCloud.select(labelsLogicalMask);

    Display the filtered point cloud.

    figure
    pcshow(trimmedPtCloud)
    title("After Filtering: Mostly Tree-like Structures")
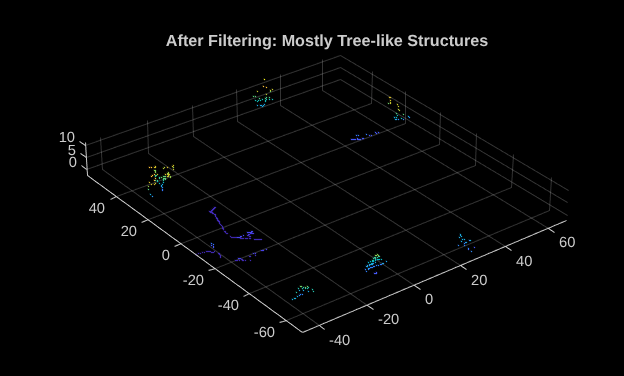
    Figure contains an axes object. The axes object with title After Filtering: Mostly Tree-like Structures contains an object of type scatter.

    Load point cloud data that includes scans of trees.

    ld = load("drivingLidarPoints.mat"); 
    ptCloud = ld.ptCloud;

    Segment the point cloud into clusters.

    minDistance = 3;
    [labels,numClusters] = pcsegdist(ptCloud,minDistance);

    Display the clustered point cloud.

    figure
    pcshow(ptCloud.Location,labels)
    colormap(hsv(numClusters))
    title("Point Cloud Clusters")
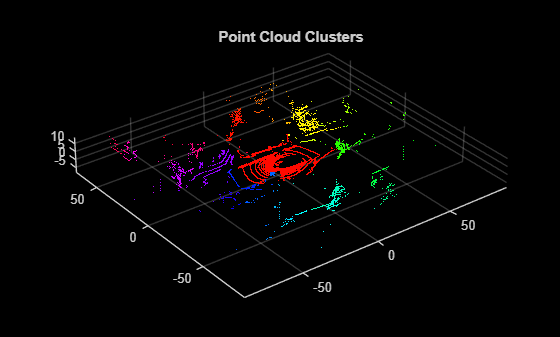
    Figure contains an axes object. The axes object with title Point Cloud Clusters contains an object of type scatter.

    Compute the density for each cluster.

    clusterprops = pcclusterprops(ptCloud,labels,["Density"]);

    Extract the density values from the cluster properties.

    densityOfClusters = [clusterprops.Density];

    Display the density values.

    figure;
    stem(densityOfClusters)
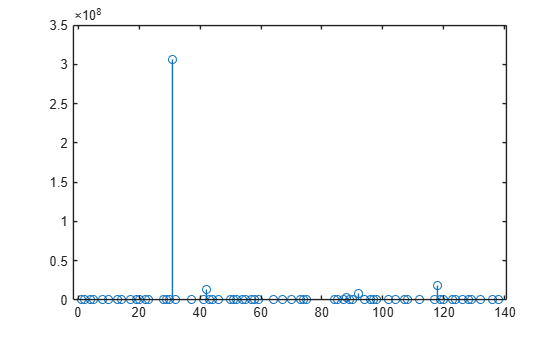
    Figure contains an axes object. The axes object contains an object of type stem.

    Select clusters based on a density range.

    minDensity = 0.7;
    maxDensity = 3;
    logicalIdx = (densityOfClusters > minDensity) & (densityOfClusters < maxDensity);

    Get the labels of the selected clusters.

    allLabelsList = [clusterprops.Label];
    labelsToKeep  = allLabelsList(logicalIdx);

    Create a logical mask for the selected clusters.

    labelsLogicalMask = ismember(labels,labelsToKeep);

    Extract the selected clusters from the point cloud.

    trimmedPtCloud = select(ptCloud,labelsLogicalMask);

    Display the filtered point cloud.

    figure
    pcshow(trimmedPtCloud)
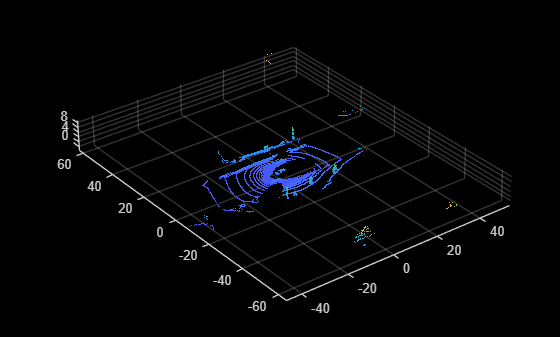
    Figure contains an axes object. The axes object contains an object of type scatter.

    Input Arguments

    collapse all

    Input point cloud, specified as a pointCloud object. The point cloud contains the 3-D coordinate data for all points, along with optional intensity information.

    Cluster label assignments, specified as an M-by-1 vector for an unorganized point cloud or as an M-byN matrix for an organized point cloud. Each element in the matrix corresponds to a point in ptCloud and indicates which cluster that point belongs to. A label value of 0 indicates an invalid or unassigned point, which the function ignores. Cluster labels do not have to be sequential, and can contain gaps in the label numbering. For unorganized point clouds, M is the number of points in ptCloud. For organized point clouds, M is the number of rows and N is the number of columns in ptCloud.Location.

    Selected properties to compute, specified as a string scalar, character vector, or vector of strings. The output always includes the "Label" property.

    PropertyCode Generation
    "All"See below
    "Label" Yes
    "NumberOfPoints"Yes
    "Centroid"Yes
    "BoundingBox"Yes
    "OrientedBoundingBox"Yes
    "EigenValues"Yes
    "EigenVectors"Yes
    "PrincipalAxisLength"Yes
    "ConvexVolume"No
    "Density"No
    "Orientation"Yes
    "Linearity"Yes
    "Planarity"Yes
    "Sphericity"Yes
    "MinIntensity"Yes
    "MaxIntensity"Yes
    "MeanIntensity"Yes

    Output Arguments

    collapse all

    Measured cluster properties, returned as a structure array with one element per cluster. Each structure contains a Label field with a cluster identifier, plus one field for each returned property. Some properties can return NaN values when a cluster contains too few points or does not contain sufficient geometric information to support the requested calculation. For more information, see Tips.

    PropertyDescriptionExample
    "All"Returns all available properties listed. 
    "Label"

    Cluster label, returned as a numeric scalar. This property indicates which cluster the other properties in the same structure correspond to. Cluster labels do not have to be sequential and can contain gaps in the label numbering.

    The output always includes the "Label" field.

    Label=3 indicates that the properties correspond to cluster 3.
    "NumberOfPoints"Number of points in the cluster, returned as an integer. The value equals the count of points assigned to the cluster based on the input labels.NumberOfPoints=150 indicates that the cluster contains 150 points.
    "Centroid"Centroid of the cluster, returned as a numeric 3-element row vector of the form [x y z]. The values represent the average coordinates of all points in the cluster.Centroid=[1.2 3.5 0.8] indicates the mean location of the cluster points.
    "BoundingBox"Axis-aligned bounding box, returned as a numeric 6-element row vector of the form [xmin xmax ymin ymax zmin zmax]. The values represent the minimum and maximum limits of the cluster along each axis.

    BoundingBox=[0 5 1 6 -2 3] defines the spatial extent of the cluster.

    • x spans from 0 to 5

    • y spans from 1 to 6

    • z spans from -2 to 3

    "OrientedBoundingBox"

    Smallest cuboid containing the cluster, returned as a numeric 9-element row vector of the form [xctr yctr zctr xlen ylen zlen xrot yrot zrot].

    • xctr, yctr, and zctr specify the center of the cuboid.

    • xlen, ylen, and zlen specify the lengths of the cuboid along each axis before rotation.

    • xrot, yrot, and zrot specify the rotation angles, in degrees, of the cuboid about the x-, y-, and z-axes, respectively.

    Angles follow the right-hand rule: a positive angle is a counterclockwise rotation when viewed from the positive end of the axis toward the origin.

    This property describes the orientation of a fitted cuboid that encloses the cluster. The orientation is represented using a ZYX Euler-angle decomposition (R = Rz * Ry * Rx). The returned vector is ordered as [xrot yrot zrot].

    OrientedBoundingBox=[2 3 1 4 2 5 10 0 30] indicates:

    • Center at (2, 3, 1)

    • Dimensions of 4 (x), 2 (y), and 5 (z)

    • Rotation angles of 10° about x, 0° about y, and 30° about z.

    "EigenValues"Eigenvalues of the point distribution in the cluster, returned as a numeric 3-element row vector.

    EigenValues=[5.2; 2.1; 0.4] indicates:

    • Largest variance along the first principal direction (5.2)

    • Intermediate variance along the second (2.1)

    • Smallest variance along the third (0.4)

    "EigenVectors"Eigenvectors of the point distribution in the cluster, returned as a numeric 3-by-3 matrix. Each column represents a principal direction.EigenVectors=[100010001] indicates the principal first principal direction aligned with the x-axis, the second principal direction aligned with the y-axis, and the third principal direction aligned with the z-axis.
    "PrincipalAxisLength"

    Principal axis lengths, returned as a numeric 3-element row vector of the form [majorAxisLength intermediateAxisLength minorAxisLength]

    The lengths are derived from the covariance-matrix eigenvalues of the cluster.

    PrincipalAxisLength = [10 6 2] indicates:

    • Major axis length of 10

    • Intermediate axis length of 6

    • Minor axis length of 2

    "ConvexVolume"Convex hull volume, returned as a positive scalar. The value represents the volume of the smallest convex region enclosing the cluster.ConvexVolume = 125.6 indicates a cluster volume of 125.6 cubic units.
    "Density"

    Cluster density, returned as a positive scalar. This value is the ratio of the number of points in the cluster to the convex hull volume.

    Density = NumberOfPoints/ConvexVolume

    Density = 1.2 indicates that the cluster has 1.2 points per unit of volume.
    "Orientation"

    Cluster orientation, returned as a numeric 3-element row vector of the form [xrot yrot zrot], in degrees. The vector represents the orientation of the principal axes of the ellipsoid that approximates the cluster and has the same normalized second central moments. The orientation is represented using a ZYX Euler-angle decomposition (R = Rz * Ry * Rx).

    Angles follow the right-hand rule: a positive angle is a counterclockwise rotation when viewed from the positive end of the axis toward the origin. The returned vector is ordered as [xrot yrot zrot].

    Orientation = [0 15 45] indicates:

    • No rotation about x

    • 15° rotation about y

    • 45° rotation about z

    "Linearity"

    Measure of linear structure, returned as a scalar in the range [0, 1]. The value indicates how strongly the cluster of points are distributed along a line.

    (λ1−λ2)/λ1

    The formula computes the relative difference between the first and second covariance-matrix eigenvalues [1].

    Linearity = 0.85 indicates that the cluster is strongly linear.
    "Planarity"

    Measure of planar structure, returned as a scalar in the range [0, 1]. The value indicates how strongly the cluster of points is distributed within a plane.

    (λ2−λ3)/λ1

    The formula computes the relative difference between the second and third covariance-matrix eigenvalues [1].

    Planarity = 0.6 indicates moderate planar characteristics.
    "Sphericity"

    Measure of volumetric structure, returned as a scalar in the range [0, 1]. The value indicates how evenly the cluster of points is distributed in all three dimensions.

    λ3/λ1

    The formula computes the ratio of the third covariance-matrix eigenvalue to the first covariance-matrix eigenvalue [1].

    Sphericity = 0.3 indicates limited volumetric distribution.
    "MinIntensity"Minimum intensity value in the cluster, returned as a scalar.MinIntensity = 12 indicates that the lowest intensity among the cluster points is 12.
    "MaxIntensity"Maximum intensity value in the cluster, returned as a numeric scalar.MaxIntensity = 255 indicates that the highest intensity among the cluster points is 255.
    "MeanIntensity"Mean intensity value of the cluster, returned as a numeric scalar.MeanIntensity = 87.5 indicates that the average intensity of the cluster points is 87.5.

    Tips

    • When properties return NaN — When the function cannot compute a property for a cluster, pcclusterprops returns NaN values for that property instead of generating an error. This situation can occur when the cluster contains too few points or does not contain sufficient geometric information to support the requested calculation. Properties that can return NaN include ConvexVolume, Density, OrientedBoundingBox, PrincipalAxisLength, Orientation, Linearity, Planarity, and Sphericity.

    • Display results as a table — You can convert the output structure array to a table for easier inspection at the command line by using struct2table.

      clusterTable = struct2table(clusterProps);

    • Track cluster labels — The output structures always contains a Label field that identifies the cluster associated with each structure. The Label field can be useful when selecting, filtering, or visualizing clusters based on computed property values.

    References

    [1] Weinmann, M., B. Jutzi, and C. Mallet. “Feature Relevance Assessment for the Semantic Interpretation of 3D Point Cloud Data." ISPRS Annals of the Photogrammetry, Remote Sensing and Spatial Information Sciences II-5/W2 (October 2013): 313–18. https://doi.org/10.5194/isprsannals-II-5-W2-313-2013.

    Extended Capabilities

    expand all

    Version History

    Introduced in R2026b