Main Content

plot

System object: phased.MFSKWaveform
Namespace: phased

Plot continuous MFSK waveform

Syntax

plot(sMFSK)
plot(sMFSK,Name,Value)
plot(sMFSK,Name,Value,LineSpec)
h = plot(___)

Description

plot(sMFSK) plots the real part of the waveform specified by sMFSK.

plot(sMFSK,Name,Value) plots the waveform with additional options specified by one or more Name,Value pair arguments.

plot(sMFSK,Name,Value,LineSpec) specifies the same line color, line style, or marker options that are available in the MATLAB® plot function.

h = plot(___) returns the line handle in the figure.

Input Arguments

expand all

MFSK waveform, specified as a phased.MFSKWaveform System object.

Example: sMFSK = phased.MFSKWaveform;

Plot style, specified as a character vector. You can specify the same line color, style, or marker options that are available in the MATLAB plot function. If you specify a PlotType value of 'complex', then LineSpec applies to both the real and imaginary subplots.

Example: 'k.'

Name-Value Arguments

Specify optional pairs of arguments as Name1=Value1,...,NameN=ValueN, where Name is the argument name and Value is the corresponding value. Name-value arguments must appear after other arguments, but the order of the pairs does not matter.

Before R2021a, use commas to separate each name and value, and enclose Name in quotes.

Waveform component to plot, specified as the comma-separated pair consisting of 'PlotType' and one of the following:

  • 'real' — Plots the real part of the waveform

  • 'imag' — Plots the imaginary part of the waveform

  • 'complex' — Plots both parts of the waveform

Example: 'PlotType','complex'

Index of the step to plot, specified as the comma-separated pair consisting of 'StepIdx' and a positive integer. If you specify a 'StepIdx' value greater than 'StepsPerSweep', the frequency corresponds to the mod('StepIdx','StepsPerSweep') value.

Output Arguments

expand all

Plot handle(s) to the line or lines in the figure, returned as a double. When PlotType is set to 'complex', h is a 2-by-1 column vector. The first and second elements of this vector are the handles to the lines in the real and imaginary subplots, respectively.

Examples

expand all

Construct an MFSK waveform with a sample rate of 1 MHz and a sweep bandwidth of 0.1 MHz. Assume 52 steps with a step time of 4 milliseconds. Set the frequency offset to 1 kHz. There are 4000 samples per step.

fs = 1e6;
fsweep = 1e5;
tstep = 4e-3;
numsteps = 52;
foffset = 1000;
noutputsteps = 4;
sMFSK = phased.MFSKWaveform('SampleRate',fs,...
    'SweepBandwidth',fsweep,...
    'StepTime',tstep,...
    'StepsPerSweep',numsteps,...
    'FrequencyOffset',foffset,...
    'OutputFormat','Steps',...
    'NumSteps',noutputsteps);

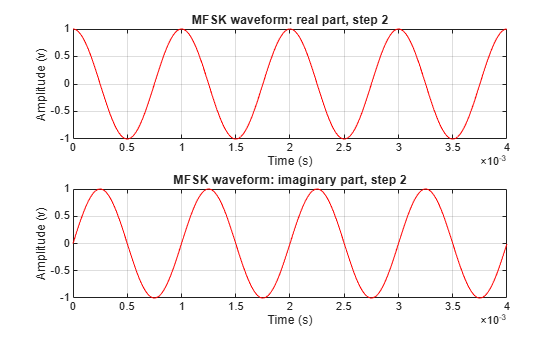
Plot the real and imaginary components of the second step of the waveform using the plot method. Set the plot color to red.

plot(sMFSK,'PlotType','complex','StepIdx',2,'r')

Version History

Introduced in R2015a