Design Experiments for Spark Ignition Engine Models
Context
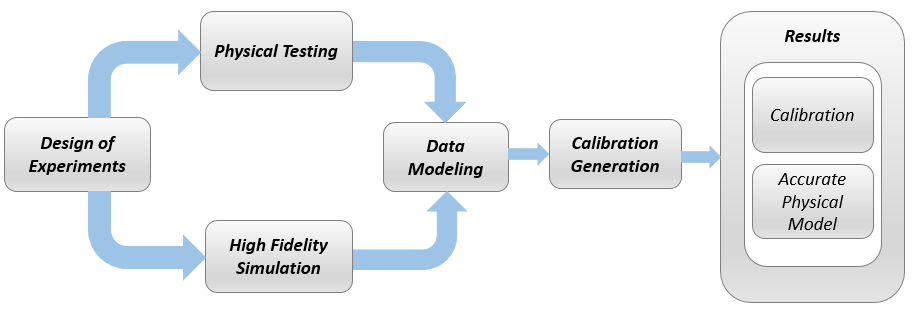
This topic describes design of experiments for the gasoline one-stage case study. To view the high-level workflow, see Spark Ignition (SI) Calibration Workflow.
Benefits of Design of Experiment
You use design of experiment to efficiently collect engine data. Testing time (on a dyno cell, or as in this case, using high-fidelity simulation) is expensive, and the savings in time and money can be considerable when a careful experimental design takes only the most useful data. Dramatically reducing test time is increasingly important as the number of controllable variables in more complex engines is growing. With increasing engine complexity, the test time increases exponentially.
Power Envelope Survey Testing
The first stage to solve this calibration problem is to determine the boundaries of the feasible system settings. You need to generate the power envelope to constrain the design points. To do this, data was collected using simulation across a range of speed and torque. The initial survey determined boundaries that produce:
Acceptable exhaust temperature (not too high to burn piston crowns)
Achievable torque production
Acceptable BSFC (not too high)
Avoids knock
The envelope must include the idle region of low torque and speed, where the cams must be parked. The cam timings are set to zero in the idle design.
The initial survey design and test data provide information about the engine operating envelope. This information was used to create constraints for the final design, to collect detailed data about the engine behavior within those boundaries. You can then use this data to create response models for all the responses you need in order to create an optimal calibration for this engine.
The final design used 238 points for this engine with 4 inputs: speed, load, intake and exhaust cam. You can view the constraints defining the operating envelope by following the steps below.
Create Designs and Collect Data
You can use a space-filling design to maximize coverage of the factors' ranges as quickly as possible, to understand the operating envelope.
To create a design, you need to first specify the model inputs. Open the example file to see how to define your test plan.
Open MATLAB®. On the Apps tab, in the Automotive group, click MBC Model Fitting.
In the Model Browser home page, in the Case Studies list, select Dual CAM gasoline engine with spark optimized during testing. Alternatively, select File > Open Project and browse to the example file
gasolineOneStage.mat, found inmatlab\toolbox\mbc\mbctraining.To view how to define your test plan design inputs, in the All Models tree, click the top project node,
gasolineOneStage. In the Common Tasks pane, click Design experiment. In the New Test Plan dialog box, observe the inputs pane, where you can change the number of model inputs and specify the input symbols, signals and ranges. This example project already has inputs defined, so click Cancel.Click the first test plan node in the All Models tree,
gasolineOneStageDoE. The test plan view appears.Observe the inputs listed on the test plan diagram. Double-click the Inputs block to view the ranges and names (symbols) for variables in the Input Factor Set Up dialog box. The design inputs are torque, speed, intake cam, and exhaust cam. The dynamometer test setup is in speed/torque and so the design is in speed/torque.
Close the dialog box by clicking Cancel.
After setting up inputs, you can create designs. In the Common Tasks pane, click Design experiment.
The Design Editor opens. Here, you can see how these designs are built.
Click the first design in the tree,
gasolineOneStageIdle. If you do not see a 2D plot, select View > Current View > 2D Design Projection. Then select each design in the tree in turn.The first design in the tree,
gasolineOneStageIdle, concentrates points in the idle area with cams parked. It uses the Sobol Sequence space-filling design type to maximize coverage. To park the cams, after creating the idle region space-filling design, the cam phaser positions are set to park position (0,0).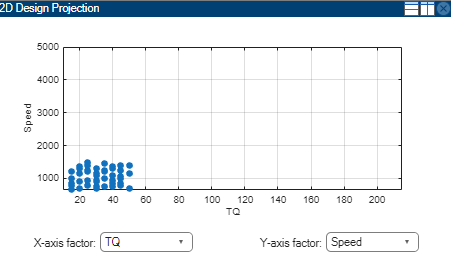
The second design,
gasolineOneStageNonIdle, is another Sobol Sequence space-filling design to span the non-idle engine operating envelope.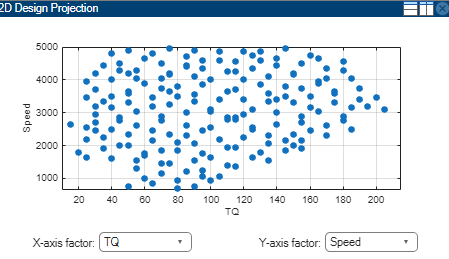
The final design is called
gasolineOneStageMergedbecause it contains the other two merged designs to cover the whole envelope.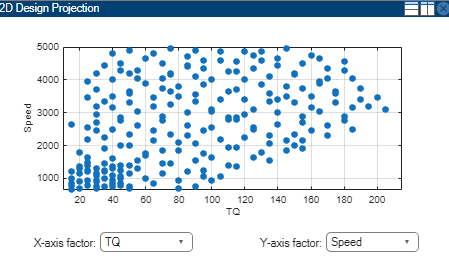
To see how the constraints are set up, select Edit > Constraints.
In the Constraints Manager dialog box, select each torque constraint in turn and click Edit. Observe the maximum and minimum torque constraints define the upper and lower boundary of the feasible operating envelope. These constraints were developed prior to this design in initial wide-open throttle and closed-throttle engine performance testing.
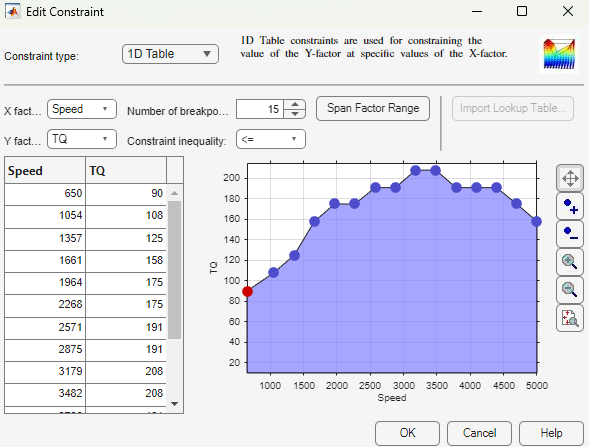
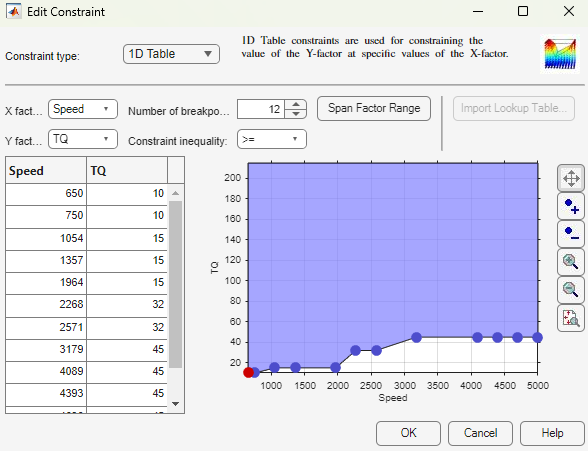
Observe that you can define areas to exclude by dragging points, typing in the edit boxes, or using the Table Editor tab.
To leave the constraint unchanged, click Cancel.
Observe the
Propertiesof the selectedgasolineOneStageMergeddesign under the tree, listing 2 constraints, and 238 points.To experiment with a new design and avoid editing the prior designs, select the root
Designsnode and select File > New Design.Add the constraints by selecting Edit > Constraints. In the Constraints Manager dialog box, click Import. Select the torque max and min constraints from the merged design and click OK. In the following dialog boxes, click OK to return to the Design Editor.
See how to construct a similar constrained space-filling design by selecting Design > Space Filling > Design Browser, or click the space-filling design toolbar button.
In the Space-Filling Design Browser, observe the design type is
Sobol
                Sequence
, and specify a Number of points. View the preview of design points. Click OK.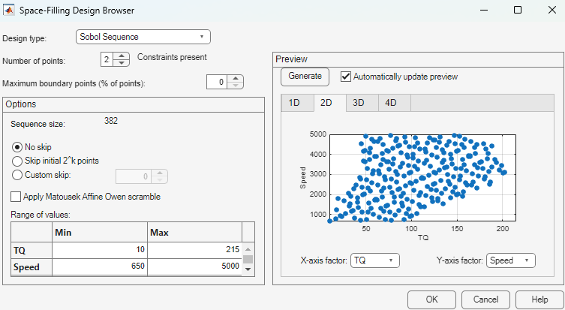
Click
gasolineOneStageMerged. This design style isCustombecause the points are rounded, using Edit > Round Factor. You might also sort design points to make data collection easier on a dyno. To preserve the space-filling sequence in case you want to add more points later, you can copy a design before rounding or sorting.gasolineOneStageMergedis the final design used to collect data. To make it easier to collect the data, the points are rounded as follows:Intake and exhaust cam timings are rounded to 1 degree (2% of range)
Speed is rounded to 50 RPM (1% of range)
Torque is rounded to 5 Nm (3% of range)
You can export designs or copy and paste design points into other files to proceed to data collection.
Close the Design Editor.
The final gasolineOneStageMerged design was used to collect data from
the GT-Power model with the Simulink® and Simscape™ test harness. The example Model Browser project file
gasolineOneStage.mat in the mbctraining folder
contains this data, imported to the Model Browser after the data collection.
Data Collection and Physical Modeling
The toolbox provides the data in the projects for you to explore this calibration example.
MathWorks® collected the data using simulation tools. Control and simulation models were constructed using a Simulink and Stateflow® test harness. Constrained experimental designs were constructed using Model-Based Calibration Toolbox™. The points specified in the design were measured using the GT-Power engine simulation tool from Gamma Technologies (see https://www.gtisoft.com). The engine to calibrate is a direct-injected 1.5L spark ignition turbocharged engine with dual cam-phasers and turbocharger wastegate. This model is part of a GT-POWER engine library from Gamma Technologies.
To collect the data, Simulink and Stateflow controlled the GT-Power engine model to the desired Design of Experiments points.
Note
Simulation time was reduced from days to minutes using Parallel Computing Toolbox™.
This simulation of 238 design points took 20 minutes to run in parallel on multiple machines in the cloud. Running on a single core, the same simulation takes 3 days. Parallel Computing Toolbox distributed the work to the 225 cores on a cloud computing cluster and showed that this problem scales linearly as you add workers.
The data was used in the next step of model-based-calibration, to create statistical models.
For next steps, see Fit Empirical Models to Spark Ignition Engine Calibration Data.