複数の対話型コントロールをもつライブ スクリプトの作成
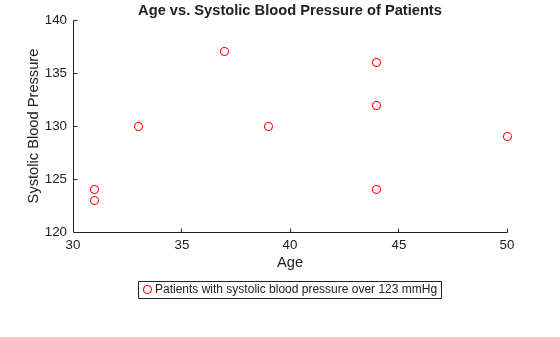
R2026bこの例では、対話型コントロールを使用して、MATLAB で患者データを可視化および調査する方法を示します。さまざまな対話型コントロールを使用して、患者のリストをフィルター処理し、そのフィルター処理したリストの年齢と収縮期血圧をプロットして、特定の血圧を超えている患者を強調表示します。
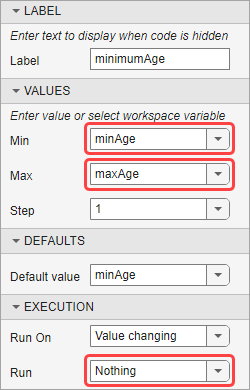
この例では、変数を使用して、スライダーとスピナーの値、およびドロップダウン リストの項目を制御します。たとえば、患者のリストを場所でフィルター処理するには、ドロップダウン リストを挿入し、変数 locationStrings を選択して項目をリストに設定します。患者のリストを年齢でフィルター処理するには、スライダーを挿入し、[最小値] および [最大値] の値として変数 minAge と変数 maxAge を選択します。収縮期血圧のしきい値を指定するには、スピナーを挿入し、[最小値] および [最大値] の値として変数 minPressure と変数 maxPressure を選択します。
[Filter Data] ボタンが押された場合のみデータをフィルターするには、ドロップダウン リスト、チェックボックス、スライダー、および編集フィールドの実行オプションの [実行] を [Nothing] に設定します。
コントロールの表示とそれによる対話を行うため、この例をブラウザーまたは MATLAB で開きます。
サンプルの患者データの取得とフィルター処理
ファイル ブラウザーを使用して、患者データが含まれているファイルを選択し、患者データから table を作成します。ドロップダウン リスト、チェックボックス、スライダー、および編集フィールドを使用して、場所、喫煙状態、年齢、患者の姓に示される文字など、患者のフィルター処理情報を指定します。[Filter Data] ボタンを使用して、データをフィルター処理します。
filename ="patients.xls"; T = readtable(filename); locationStrings = ["VA Hospital","County General Hospital","St. Mary's Medical Center"]; selectedLocation =
locationStrings(1); isSmoker =
true; maxAge = max(T.Age); minAge = min(T.Age); minimumAge =
31; nameContains =
"e";
idx = T.Location==selectedLocation & T.Smoker==isSmoker & T.Age>=minimumAge; if ~strcmp(nameContains,"") idx = idx & contains(T.LastName,nameContains); end TFiltered = T(idx,:);
フィルター処理した患者データのプロット
フィルター処理した患者データの年齢と収縮期血圧をプロットすることで、特定の血圧を超えている患者を強調表示します。スピナーを使用して、血圧のしきい値を指定します。
minPressure = min(TFiltered.Systolic); maxPressure = max(TFiltered.Systolic); thresholdPressure =123; TOverThreshold = TFiltered(TFiltered.Systolic>=thresholdPressure,:); sp1 = scatter(TFiltered.Age,TFiltered.Systolic); hold on sp2 = scatter(TOverThreshold.Age,TOverThreshold.Systolic,"red"); hold off title("Age vs. Systolic Blood Pressure of Patients") xlabel("Age") ylabel("Systolic Blood Pressure") legendText = sprintf("Patients with systolic blood pressure over %d mmHg",thresholdPressure); legend(sp2,legendText,Location="southoutside")