iddataPlotOptions
(Not recommended) Option set for plot when plotting data
contained in an iddata object
iddataPlotOptions is not recommended. Use dataPlotOptions instead to create option sets for idplot. For more information, see Version History.
Syntax
Description
opt = iddataPlotOptions('time')
opt = iddataPlotOptions('frequency')
opt = iddataPlotOptions(___,'identpref')
Examples
Output Arguments
Option set containing the specified options for idplot. The structure has
the following fields:
| Field | Description | ||||||||||||||||||||||||||||||
|---|---|---|---|---|---|---|---|---|---|---|---|---|---|---|---|---|---|---|---|---|---|---|---|---|---|---|---|---|---|---|---|
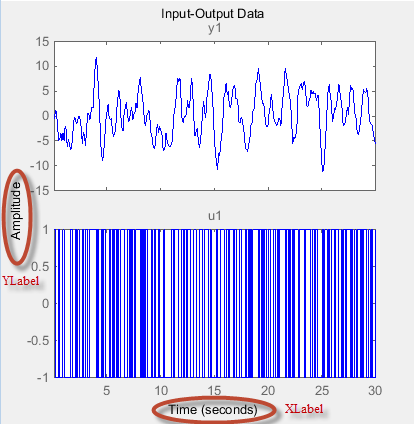
Title, XLabel,
YLabel
| Text and style for axes labels and plot title, specified as a structure array with the following fields:
| ||||||||||||||||||||||||||||||
TickLabel | Tick label style, specified as a structure array with the following fields:
| ||||||||||||||||||||||||||||||
Grid | Show or hide the grid, specified as one of the
following values: Default:
| ||||||||||||||||||||||||||||||
GridColor | Color of the grid lines, specified as one of the
following values: vector of RGB values in the range
Default:
| ||||||||||||||||||||||||||||||
XlimMode,
YlimMode | Axes limit modes, specified as one of the following values:
Default:
| ||||||||||||||||||||||||||||||
Xlim, Ylim
| Axes limits, specified as maximum and minimum values. Default: | ||||||||||||||||||||||||||||||
IOGrouping
| Grouping of input-output pairs, specified as one of
the following values: Default:
| ||||||||||||||||||||||||||||||
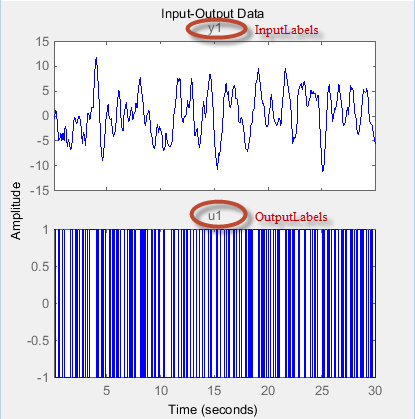
InputLabels,
OutputLabels
| Input and output label styles on individual plot axes, specified as a structure array with the following fields:
| ||||||||||||||||||||||||||||||
InputVisible,
OutputVisible | Visibility of input and output channels, specified
as one of the following values: Default:
| ||||||||||||||||||||||||||||||
Orientation | Orientation of the input and output data plots, specified as one of the following values:
Default:
| ||||||||||||||||||||||||||||||
For time-domain data plots only:
| |||||||||||||||||||||||||||||||
For frequency-domain data plots only:
| |||||||||||||||||||||||||||||||