comparefis
Description
Examples
Compare FIS Outputs
Load a Mamdani fuzzy inference system.
fisM = readfis("tipper");
Create a Sugeno version of the same fuzzy system.
fisS = convertToSugeno(fisM);
fisS.Name = "tipperSugeno";
Create random reference input values.
x = 10*rand(100,2);
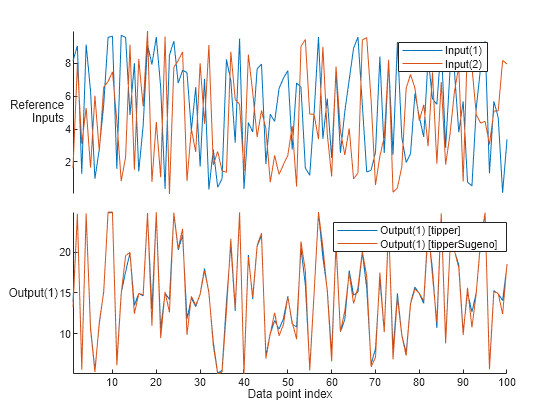
Compare the outputs of the two fuzzy systems.
comparefis([fisM fisS],x)
The output of the Sugeno system closely matches the output of the Mamdani system.
Compare FIS Outputs to Reference Data
Evaluate tuned FIS performance from Tune Fuzzy Inference System at the Command Line.
Load the training data and extract a set of validation data.
[data,name] = loadGasData; X = data(:,1:6); Y = data(:,7); vldX = X(2:2:end,:); vldY = Y(2:2:end,:);
Load the trained FIS objects, including an intermediate FIS with learned rules and a final FIS with tuned membership function parameters.
tunedfis = load("tunedfismpgprediction.mat"); fisLearnedRules = tunedfis.fisout1; fisLearnedRules.Name = "LearnedRules"; fisTunedMFs = tunedfis.fisout; fisTunedMFs.Name = "TunedMFs";
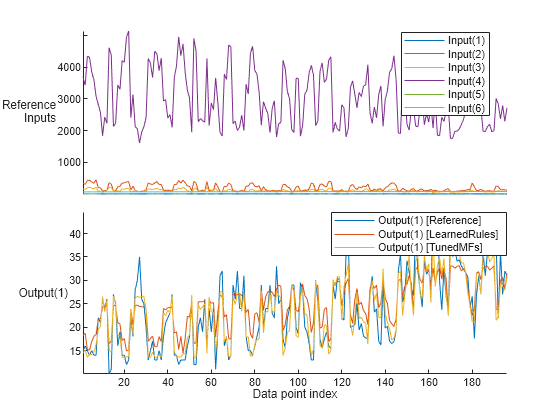
Evaluate the FIS objects and compare their outputs to the validation data.
fis = [fisLearnedRules, fisTunedMFs]; comparefis(fis,vldX,OutputData=vldY)
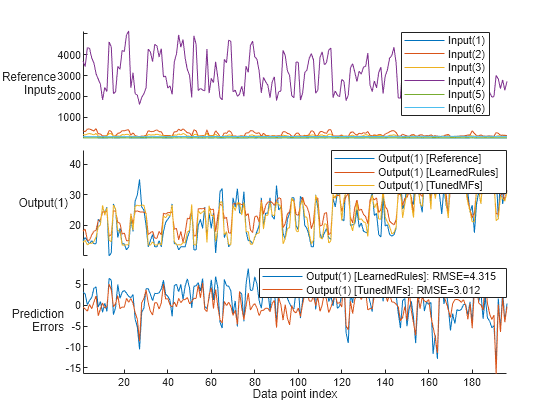
View the error plot and root-mean-squared-error (RMSE) for both FIS objects.
comparefis(fis,vldX, ... OutputData=vldY, ... ShowError=true)
Input Arguments
fis
— Fuzzy inference systems
array of fuzzy inference system objects | mamfis
object | sugfis
object | mamfistype2
object | sugfistype2
object | fistree
object
Fuzzy inference systems to evaluate, specified as one of the following FIS objects or an array of such objects. All the FIS object must have the same number of inputs and outputs and each FIS object must have a unique name.
mamfis
object — Mamdani fuzzy inference systemsugfis
object — Sugeno fuzzy inference systemmamfistype2
object — Type-2 Mamdani fuzzy inference systemsugfistype2
object — Type-2 Sugeno fuzzy inference systemfistree
object — Tree of interconnected fuzzy inference systems.
If you specify a fistree
object in fis
, all
the fuzzy systems in fis
must be fistree
objects.
x
— Input values
array
Input values, specified as an
M
-by-NX array, where
M
is the number of reference data points and
NX is the number of inputs in
fis
.
Name-Value Arguments
Specify optional pairs of arguments as
Name1=Value1,...,NameN=ValueN
, where Name
is
the argument name and Value
is the corresponding value.
Name-value arguments must appear after other arguments, but the order of the
pairs does not matter.
Example: MergeInputs=false
plots each input variable in its own
axes.
OutputData
— Reference output values
[]
(default) | array
Reference output values, specified as an
M
-by-NY array,
where M
is the number of reference data points and
NY is the number of outputs in
fis
.
ShowLegend
— Option to show plot legend
true
(default) | false
Option to display the plot legend, specified as a logical value.
true
— Display the legend.false
— Do not display the legend.
ShowError
— Option to plot the output error
false
(default) | true
Option to plot the output error, specified as a logical value.
true
— Plot the output error.false
— Do not plot the output error.
MergeInputs
— Option to plot all inputs on the same axes
true
(default) | false
Option to plot all inputs on the same axes, specified as a logical value.
true
— Plot all inputs on the same axes.false
— Plot each input in a separate axes.
MergeOutputs
— Option to plot all outputs on the same axes
true
(default) | false
Option to plot all outputs on the same axes, specified as a logical value.
true
— Plot all outputs on the same axes.false
— Plot each output in a separate axes.
MergeErrors
— Option to plot all errors on the same axes
true
(default) | false
Option to plot all errors on the same axes, specified as a logical value.
true
— Plot all errors on the same axes.false
— Plot each error in a separate axes.
SelectedInputs
— Input variables to plot
"all"
(default) | vector of positive indices | []
Input variables to plot, specified as a vector of positive indices. To plot all
input variables, set SelectedInputs
to "all"
.
To suppress the input-signal plot, set SelectedInputs
to
"[]"
.
SelectedOutputs
— Output variables to plot
"all"
(default) | vector of positive indices
Output variables to plot, specified as a vector of positive indices. To plot all
output variables, set SelectedOutputs
to
"all"
.
SelectedFIS
— FISs simulation results to plot
"all"
(default) | vector of positive indices
FISs to plot, specified as a vector of positive indices. To plot the simulation
results for all FISs, set SelectedFIS
to
"all"
.
NumSamplePoints
— Number of sample points for output defuzzification
101
(default) | integer greater than 1
Number of sample points for output defuzzification when , specified as an integer greater than 1.
Dependencies
comparefis
ignores this property when evaluating a Sugeno
FIS.
Alternative Functionality
App
You can interactively compare FIS outputs using the Fuzzy Logic Designer app. For more information, see Analyze Fuzzy System Using Fuzzy Logic Designer.
Version History
Introduced in R2024b
MATLAB コマンド
次の MATLAB コマンドに対応するリンクがクリックされました。
コマンドを MATLAB コマンド ウィンドウに入力して実行してください。Web ブラウザーは MATLAB コマンドをサポートしていません。
Select a Web Site
Choose a web site to get translated content where available and see local events and offers. Based on your location, we recommend that you select: .
You can also select a web site from the following list:
How to Get Best Site Performance
Select the China site (in Chinese or English) for best site performance. Other MathWorks country sites are not optimized for visits from your location.
Americas
- América Latina (Español)
- Canada (English)
- United States (English)
Europe
- Belgium (English)
- Denmark (English)
- Deutschland (Deutsch)
- España (Español)
- Finland (English)
- France (Français)
- Ireland (English)
- Italia (Italiano)
- Luxembourg (English)
- Netherlands (English)
- Norway (English)
- Österreich (Deutsch)
- Portugal (English)
- Sweden (English)
- Switzerland
- United Kingdom (English)