plotTrajectory
軌跡プロッターで一連の軌跡をプロットする
説明
plotTrajectory( は、軌跡プロッターを介して、trajPlotter,trajCoordList)trajCoordList で指定された軌跡をシアター プロット上にプロットします。
例
3 つの軌跡の座標を定義します。
coordinates1 = [(1:10)' (2:11)' (11:-1:2)'];
coordinates2 = coordinates1 + 1;
coordinates3 = coordinates1 + 2;
theaterPlot オブジェクトを作成し、視点角度を設定して、trajectoryPlotter オブジェクトを作成します。
tp = theaterPlot;
view(14,50)
trajPlotter = trajectoryPlotter(tp,DisplayName="Trajectories");
3 つの軌跡をプロットします。
plotTrajectory(trajPlotter,{coordinates1,coordinates2,coordinates3})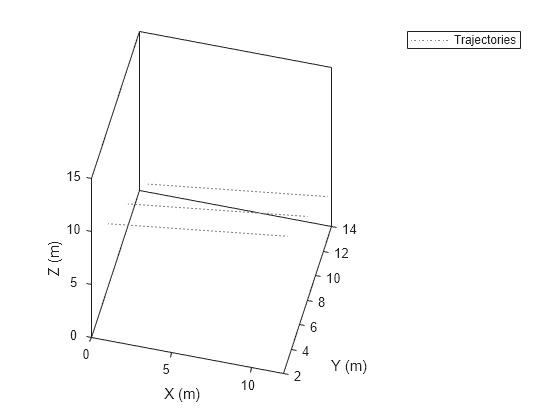
この例では、軌跡上のプラットフォーム移動のアニメーションを作成する方法を説明します。
まず、trackingScenario を作成して軌跡のウェイポイントを追加します。
ts = trackingScenario;
height = 100;
d = 1;
wayPoints = [ ...
    -30   -25   height;
    -30    25-d height;
    -30+d  25   height;
    -10-d  25   height;
    -10    25-d height;
    -10   -25+d height;
    -10+d -25   height;
    10-d -25   height;
    10   -25+d height;
    10    25-d height;
    10+d  25   height;
    30-d  25   height;
    30    25-d height;
    30   -25+d height;
    30   -25   height];
各ウェイポイントの時間を指定します。
elapsedTime = linspace(0,10,size(wayPoints,1));
次に、トラッキング シナリオでプラットフォームを作成し、trajectory メソッドを使用して軌跡情報を追加します。
target = platform(ts);
traj = waypointTrajectory('Waypoints',wayPoints,'TimeOfArrival',elapsedTime);
target.Trajectory = traj;
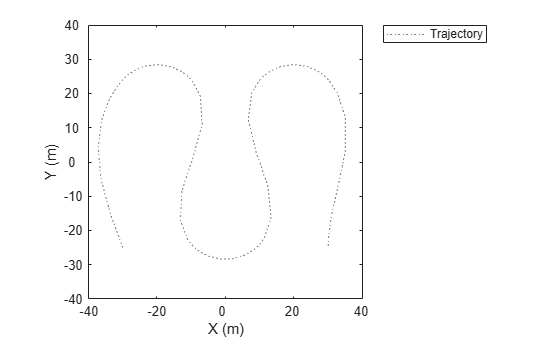
トラッキング シナリオを記録してプラットフォームの軌跡を取得します。
r = record(ts);
pposes = [r(:).Poses];
pposition = vertcat(pposes.Position);
シアター プロットを作成して記録した軌跡を表示します。
tp = theaterPlot('XLim',[-40 40],'YLim',[-40 40]);
trajPlotter = trajectoryPlotter(tp,'DisplayName','Trajectory');
plotTrajectory(trajPlotter,{pposition})
platformPlotter を使用してアニメーション化します。
restart(ts);
trajPlotter = platformPlotter(tp,'DisplayName','Platform');

while advance(ts)
    p = pose(target,'true');
    plotPlatform(trajPlotter, p.Position);
    pause(0.1)

end
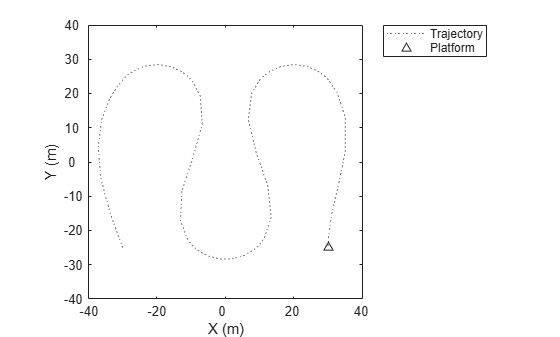
このアニメーションは、生成されたすべてのプロットをループ処理します。
入力引数
バージョン履歴
R2018b で導入