pointfig(Data) plots a point and figure
chart from a series of prices of a security. Upward price movements are plotted as
X's and downward price movements are plotted as
O's.
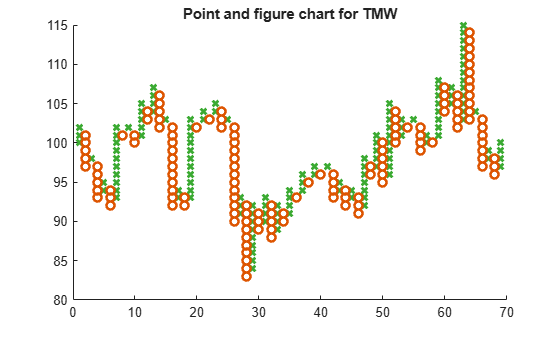
Load the file SimulatedStock.mat, which provides a timetable (TMW) for financial data for TMW stock. This Point and Figure chart is for closing prices of the stock TMW for the most recent 21 days. Note that the variable name of asset price is be renamed to 'Price' (case insensitive).
load SimulatedStock.mat
TMW.Properties.VariableNames{'Close'} = 'Price';
pointfig(TMW(1:200,:))
title('Point and figure chart for TMW')
Data for a series of prices, specified as a matrix, table, or timetable.
Timetables and tables with M rows must contain a variable
named 'Price' (case insensitive).
Data Types: double | table | timetable
(Optional) Valid axis object, specified as an axes object. The point and
figure plot is created in the axes specified by ax
instead of in the current axes (ax = gca). The option
ax can precede any of the input argument
combinations.
The point and figure chart is a type of
financial chart used in technical analysis to represent price movements of an asset
without considering the time dimension.
Unlike traditional charts that plot price changes over time (like candlestick or
line charts), point and figure charts focus solely on significant price movements,
allowing traders to identify trends, reversals, and support and resistance levels
more clearly. When the price rises and reaches the designated box size, an "X" is
added to the current column. If the price subsequently falls by the reversal amount,
a new column of "O"s is started. Conversely, if the price falls and reaches the box
size, an "O" is added. If the price rises by the reversal amount, a new column of
"X"s is started.
You can also select a web site from the following list
How to Get Best Site Performance
Select the China site (in Chinese or English) for best site performance. Other MathWorks country sites are not optimized for visits from your location.