Conduct Cointegration Test Using Econometric Modeler
This example models the annual Canadian inflation and interest rate series by using the Econometric Modeler app. The example performs the following actions in the app:
Test each raw series for stationarity.
Test for cointegration using the Engle-Granger cointegration test.
Test for cointegration among all possible cointegration ranks using the Johansen cointegration test.
The data set, which is stored in Data_Canada, contains annual
Canadian inflation and interest rates from 1954 through 1994.
Load and Import Data into Econometric Modeler
At the command line, load the Data_Canada.mat data
set.
load Data_CanadaAt the command line, open the Econometric Modeler app.
econometricModeler
Alternatively, open the app from the apps gallery (see Econometric Modeler).
Import DataTimeTable into the app:
On the Modeler tab, in the Import section, click the Import button
 .
.In the Import Data dialog box, select the check box for the
DataTimeTablevariable.Click Import.
The Canadian interest and inflation rate variables appear in the Time Series pane, and a time series plot of all the series appears in the Plot(INF_C) figure window.

Plot only the three interest rate series INT_L,
INT_M, and INT_S
together. In the Time Series pane, click
INT_L and Ctrl click
INT_M and INT_S. Then,
on the Plots tab, in the Plots
section, click Time Series. The time series plot
appears in the Plot(INT_L) document.
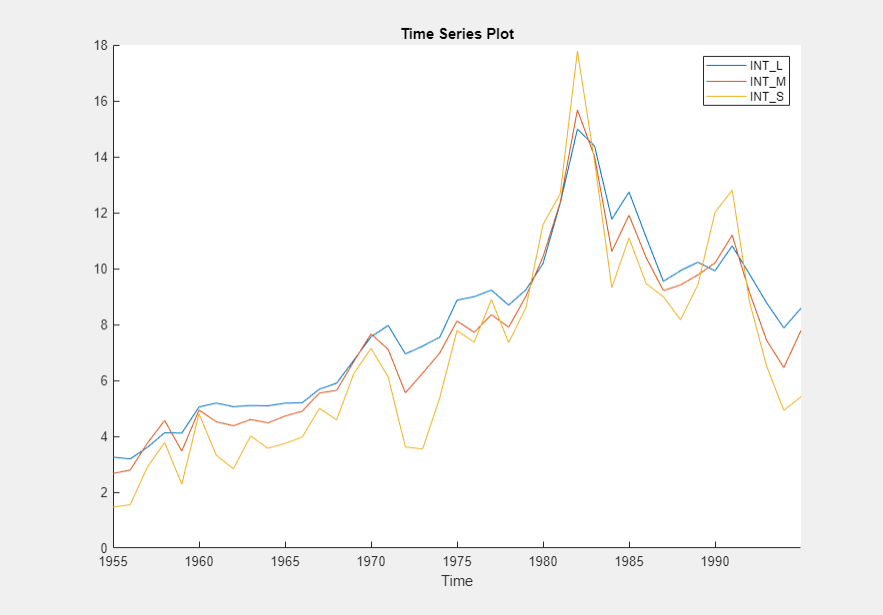
The interest rate series each appear nonstationary, and they appear to move together with mean-reverting spread. In other words, they exhibit cointegration. To establish these properties, this example conducts statistical tests.
Conduct Stationarity Test
Assess whether each interest rate series is stationary by conducting Phillips-Perron unit-root tests. For each series, assume a stationary AR(1) process with drift for the alternative hypothesis. You can confirm this property by viewing the autocorrelation and partial autocorrelation function plots.
Close all plots in the right pane, and perform the following procedure for
each series INT_L, INT_M,
and INT_S.
In the Time Series pane, click a series.
On the Modeler tab, in the Tests section, click Add Test > Phillips-Perron Test.
On the PP tab, in the Settings section, in the Number of Lags box, type
1, and in the Model list select Autoregressive with Drift.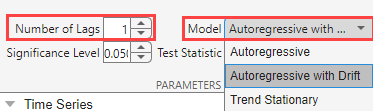
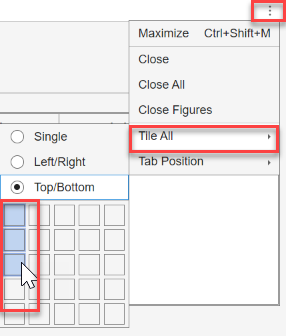
In the Tests section, click Run Test. Test results for the selected series appear in the PP(
series) tab.Position the test results to view them simultaneously by clicking Document actions > Tile All, and the (3,1) element of the position matrix.
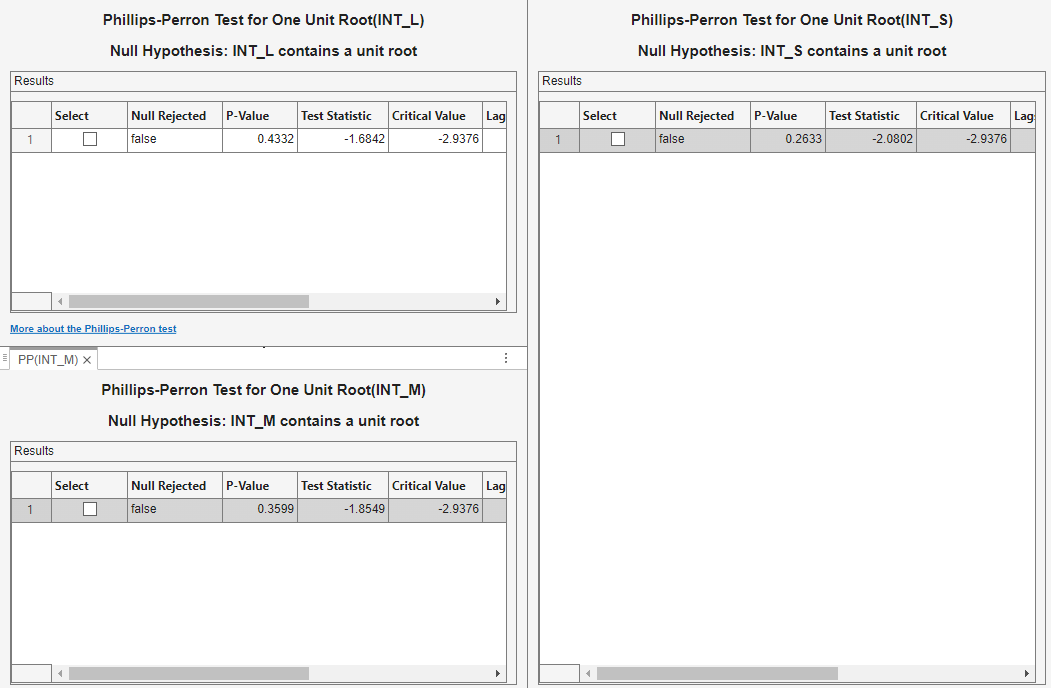
All tests fail to reject the null hypothesis that the series contains a unit root process.
Conduct Cointegration Tests
Econometric Modeler supports the Engle-Granger and Johansen cointegration tests. Before conducting a cointegration, determine whether there is visual evidence of cointegration by regressing each interest rate on the other interest rates.
In the cointegrating relation, assign
INT_Las the dependent variable andINT_MandINT_Sas the independent variables. In the Time Series pane, clickINT_L.On the Modeler tab, in the Models section, click the arrow > MLR.
In the MLR Model Parameters dialog box, select the Include check boxes of the time series
INT_MandINT_S, and clear theINF_Ccheck box. Then, clickEstimate.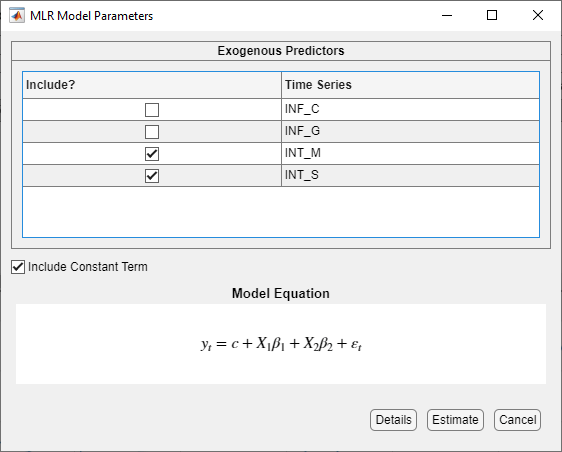
The model variable
MLR_INT_Lappears in the Models pane, its value appears in the Preview pane, and its estimation summary appears in the Fit(MLR_INT_L) document.Iterate steps 1 through 3 twice. For the first iteration, assign
INT_Mas the dependent variable andINT_LandINT_Sas the independent variables. For the second iteration, assignINT_Sas the dependent variable andINT_MandINT_Las the independent variables.On each Fit(MLR_
seriesName) tab, determine whether the residual plot appears stationary.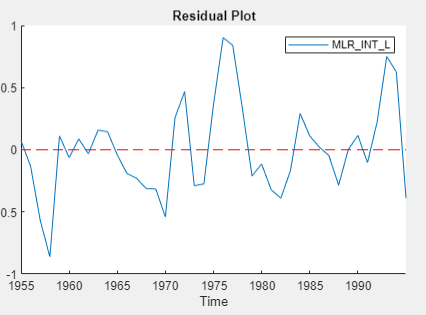
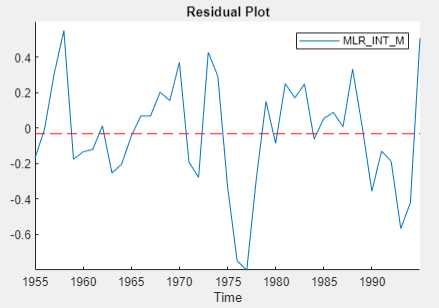
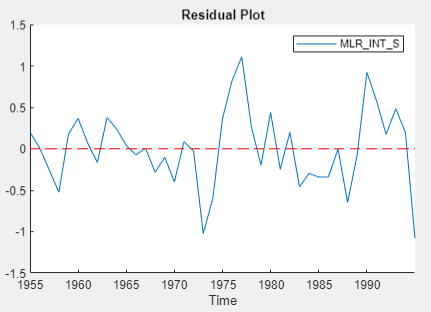
The residual series of the regression on
INT_L appears trending, and the other residual
series appear stationary. For the Engle-Granger test, choose
INT_S as the dependent variable.
Conduct Engle-Granger Test
The Engle-Granger tests for one cointegrating relation by performing two univariate regressions: the cointegrating regression and the subsequent residual regression (for more details, see Identifying Single Cointegrating Relations). Therefore, to perform the cointegrating regression, the test requires:
The response series that takes the role of the dependent variable in the first regression.
Deterministic terms to include in the cointegrating regression.
Then, the test assesses whether the residuals resulting from the
cointegrating regression are a unit root process. Available tests are the
Augmented Dickey-Fuller (adftest) or Phillips-Perron
(pptest) test. Both perform a residual regression to
form the test statistic. Therefore, the test also requires:
The unit root test to conduct, either the
adftestorpptestfunction. The residual regression model for both tests is an AR model without deterministic terms. For more flexible models, such as AR models with drift, call the functions at the command line.Number of lagged residuals to include in the AR model.
Conduct the Engle-Granger test.
In the Time Series pane, click
INT_Land Ctrl+clickINT_MandINT_S.In the Tests section, click Add Test > Engle-Granger Test.
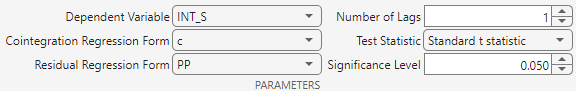
On the EGCI tab, in the Settings section:
In the Dependent Variable list, select INT_S.
In the Residual Regression Form list, select PP for the Phillips-Perron unit root test.
In the Number of Lags box, type
1.
In the Tests section, click Run Test. Test results and a plot of the cointegration relation for the largest rank appear in the EGCI tab.
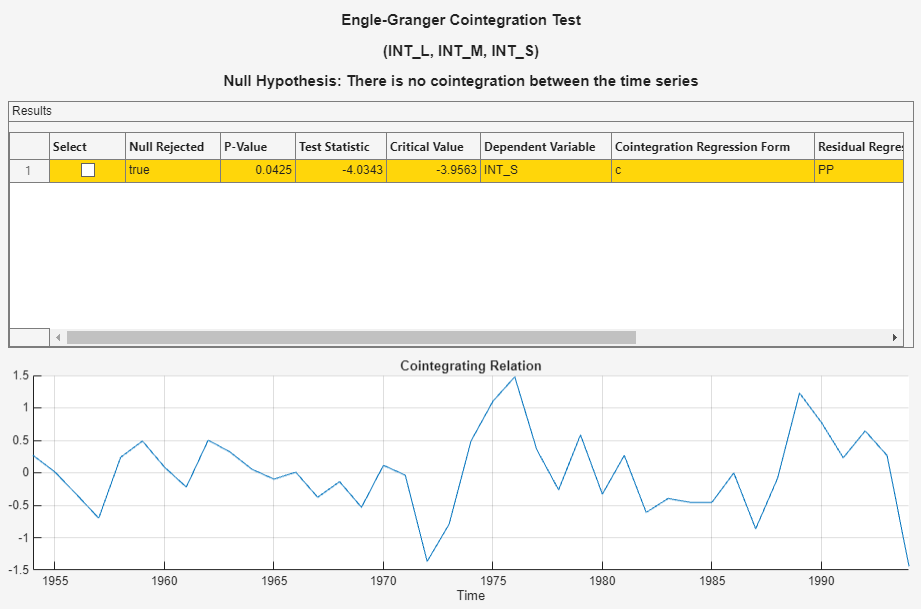
The test rejects the null hypothesis that the series does not exhibit cointegration. Although the test is suited to determine whether series are cointegrated, the results are limited to that. For example, the test does not give insight into the cointegrating rank, which is required to form a VEC model of the series. For more details, see Identifying Single Cointegrating Relations.
Johansen Test
The Johansen cointegration test runs a separate test for each possible cointegration rank 0 through m – 1, where m is the number of series. This characteristic makes the Johansen test better suited than the Engle-Granger test to determine the cointegrating rank for a VEC model of the series. Also, the Johansen test framework is multivariate, and, therefore, results are not relative to an arbitrary choice for a univariate regression response variable. For more details, see Identifying Multiple Cointegrating Relations.
The Johansen test requires:
Deterministic terms to include in the cointegrating relation and the model in levels.
Number of short-run lags in the VEC model of the series.
Because the raw series do not contain a linear trend, assume that
the only deterministic term in the model is an intercept in the cointegrating
relation (H1* Johansen form), and include 1 lagged
difference term in the model.
With
INT_L,INT_M, andINT_Sselected in the Time Series pane, click Tests section, click Add Test > Johansen Test.On the JCI tab, in the Settings section, in the Number of Lags box, type
1, and in the Model list select H1*.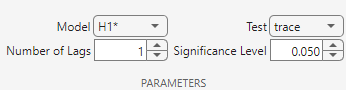
In the Tests section, click Run Test. Test results and a plot of the cointegration relation for the largest rank appear in the JCI tab.
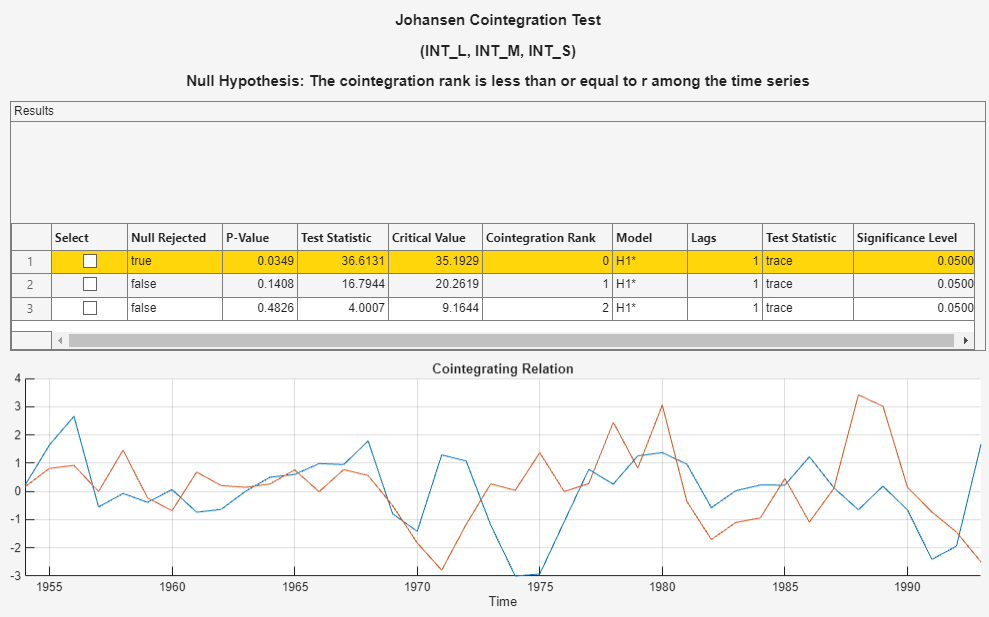
Econometric Modeler conducts a separate test for each cointegration rank 0 through 2 (the number of series – 1). The test rejects the null hypothesis of no cointegration (Cointegration rank = 0), but fails to reject the null hypotheses of Cointegration rank ≤ 1 and Cointegration rank ≤ 2. The results suggest that the cointegration rank is 1.