Import, Visualize, and Synchronize Real-World Driving Sensor Data Using Driving Log Analyzer
This example shows how to import, visualize, and synchronize real-world driving sensor data using the Driving Log Analyzer app. The app enables you to import raw sensor data and sensor data objects such as GPSData, Trajectory, CameraData, LidarData, and ActorTrackData. The app also provides options for mapping the imported raw sensor data to sensor data objects. You can use imported sensor data objects or mapped sensor data objects when building scenarios using the Scenario Builder for Automated Driving Toolbox™ support package. Using the app, you can visualize multiple sensor data objects in one or more panes, enabling you to visually validate the sensor data objects. Additionally, the app provides preprocessing options, enabling you to correct the time offset, crop, synchronize, and normalize the timestamps of multiple sensor data objects, which are essential steps before using them to construct scenarios.
Load Raw Sensor Data into Workspace and Import Data into App
Download a ZIP file, DrivingData_Seg7_Seq30.zip, which contains these raw sensor data files, and then unzip the file.
ActorTracklist_Seg7_Seq30.mat— Actor track list data, defined as a table of size 100-by-6. The table contains these columns:Timestamps,TrackID,Position,Category,Orientation, andDimension.CameraParams_Seg7_Seq30.mat— Camera parameters, defined as a structure with these fields:MountingLocation,MountingAngles,Intrinsics, andEgoOriginHeight.GPS_Seg7_Seq30.csv— Raw GPS data, defined as a table of size 184-by-4. The table contains these columns:Timestamp,Latitude,Longitude, andAltitude.LaneDetections_Seg7_Seq30.mat— Lane boundary track data, defined as alaneDataobject. The object contains the recorded lane boundary data for 100 timestamps.LidarParams_Seg7_Seq30.mat— Lidar parameters, defined as a structure with these fields:MountingLocationandMountingAngles.MultiSensorDrivingData_Seg7_Seq30.bag— Multisensor driving data, defined as a rosbag file. The rosbag file contains 100 frames of raw camera data and 60 frames of raw lidar data.
dataFolder = pwd;
dataFilename = "DrivingData_Seg7_Seq30.zip";
url = "https://ssd.mathworks.com/supportfiles/driving/data/" + dataFilename;
filePath = fullfile(dataFolder,dataFilename);
if ~isfile(filePath)
    websave(filePath,url);
end
unzip(filePath,dataFolder)
dataset = fullfile(dataFolder,"DrivingData_Seg7_Seq30");
Load the actor track list data, camera parameters, lane boundary track data, and lidar parameters into the workspace.
load(fullfile(dataset,"ActorTracklist_Seg7_Seq30.mat"))
load(fullfile(dataset,"CameraParams_Seg7_Seq30.mat"))
load(fullfile(dataset,"LaneDetections_Seg7_Seq30.mat"))
load(fullfile(dataset,"LidarParams_Seg7_Seq30.mat"))
Display the camera parameters.
cameraParams
Display the lidar parameters.
lidarParams
Open the Driving Log Analyzer app.
Select the Apps tab of the MATLAB® Toolstrip. Then, in the Automotive section, click the Driving Log Analyzer button.
Alternatively, at the MATLAB command prompt, enter this command.
drivingLogAnalyzer
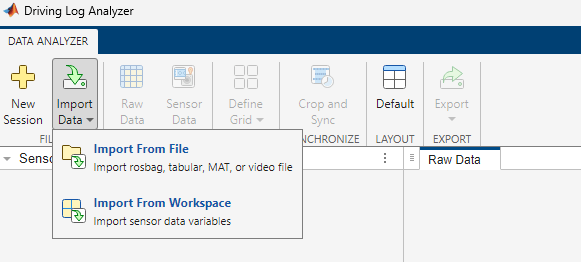
With the app open, you can import sensor data from a file or from the workspace by selecting Import Data on the app toolstrip. If you are importing the sensor data from a file, the file must be a MAT file (.mat), tabular file (.csv, .txt, .xls, or .xlsx), rosbag file (.bag), ROS 2 bag file (.db3), or a video file (.mp4, .avi, .asf, .m4v, .mj2, .mov, .mpg, or .wmv). To import data from a file, click Import Data and select Import From File.
Note: To use a rosbag or ROS 2 bag file, you must have a ROS Toolbox license.
The unzipped DrivingData_Seg7_Seq30 directory contains the GPS data GPS_Seg7_Seq30.csv. Select the .csv file and click Open. The app opens the .csv file in the Import Tool.
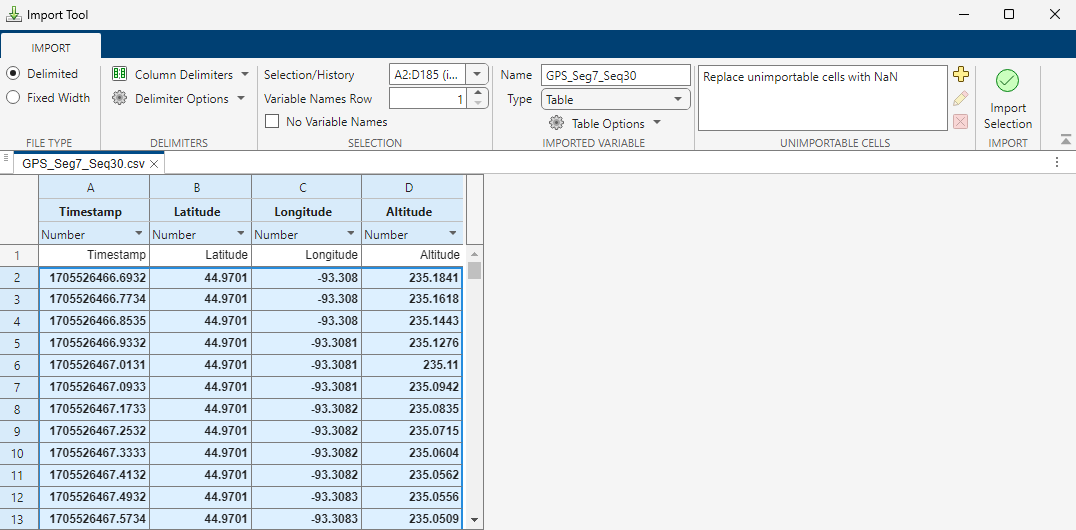
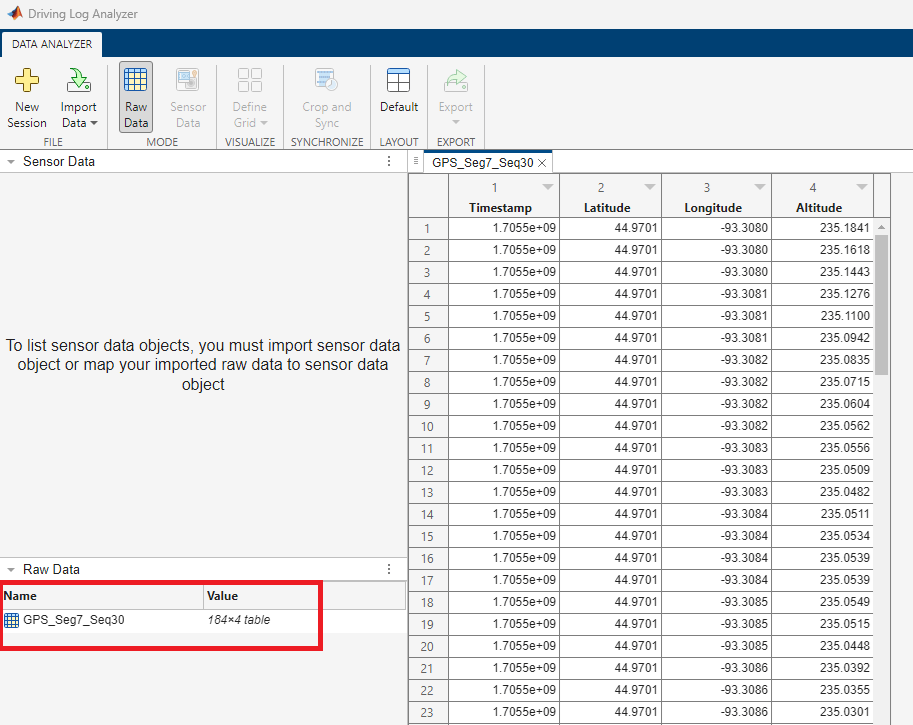
Click Import Selection to import the GPS data as a table into the app. The app lists the GPS data in the Raw Data pane, and displays the data as a tab in the main pane.
The unzipped DrivingData_Seg7_Seq30 directory contains the MultiSensorDrivingData_Seg7_Seq30.bag rosbag file. To import the camera data and lidar data from the rosbag file, click Import Data and select Import From File. Then, select the rosbag file and click Open. The app opens an Import ROSBAG dialog box that displays the sensor topics available to import from the rosbag file.
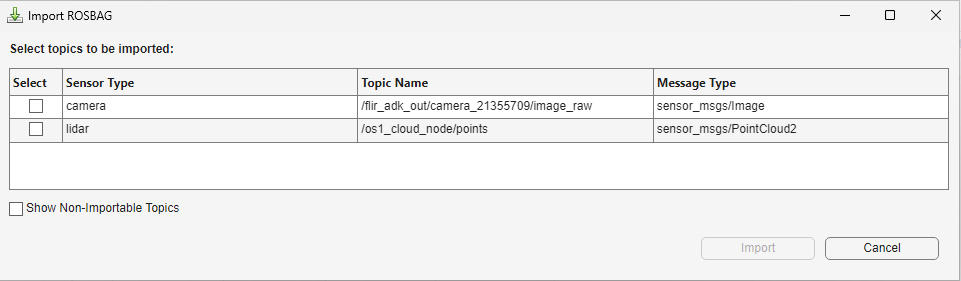
Select the camera and lidar sensors. The app enables and selects the Attach Camera Parameters and Attach Lidar Parameters options. You must manually specify the Mounting Location and Mounting Angles parameter values for the camera and lidar, as well as the Ego Origin Height parameter for the camera. You can specify these parameters by displaying and copying the values of the corresponding fields of the cameraParams and lidarParams structures from the MATLAB Command Window.
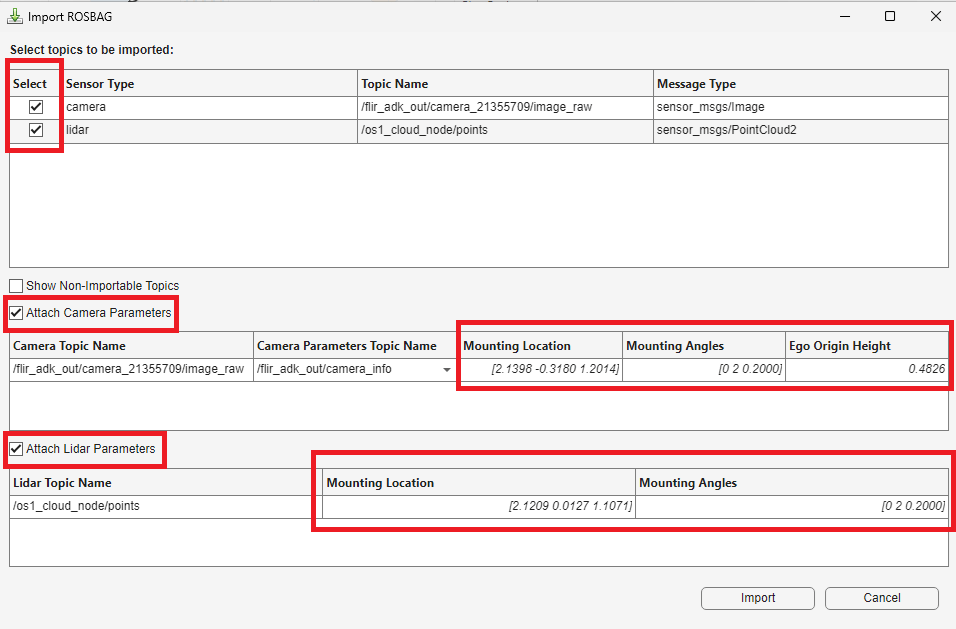
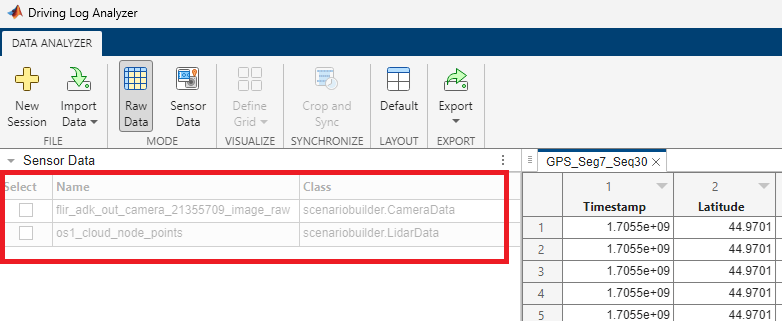
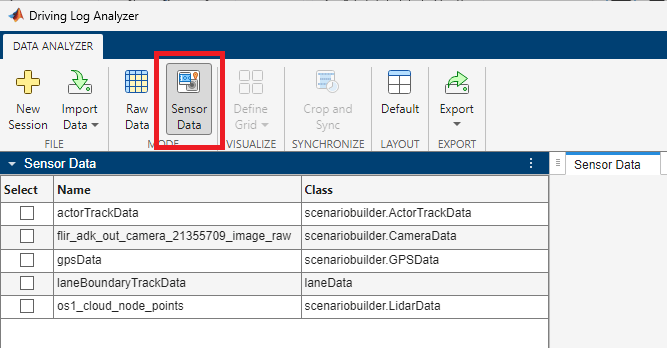
Click Import to import the camera data and lidar data into the app. The app lists the camera data and lidar data as a CameraData object and LidarData object, respectively, in the Sensor Data pane.
The actor track list data and lane boundary track data are in the MATLAB workspace.
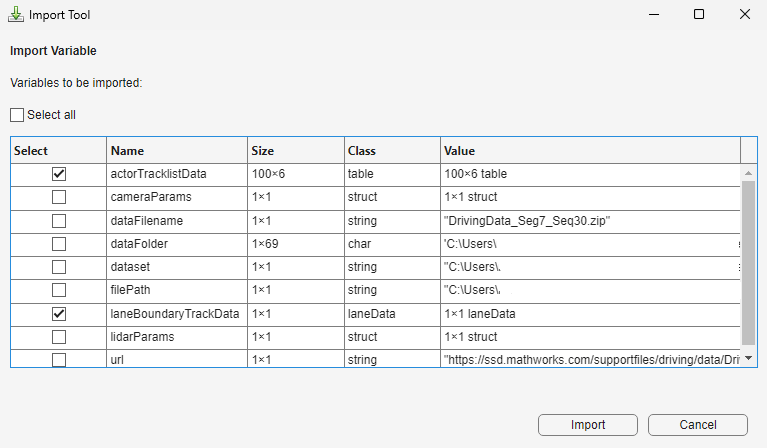
To import data from workspace, on the app toolstrip, click Import Data and select Import From Workspace.
The Import Tool dialog box displays all available workspace data to import. For this example, select actorTracklistData and laneBoundaryTrackData from the Import Variable table. Then click Import to import the selected data into the app.
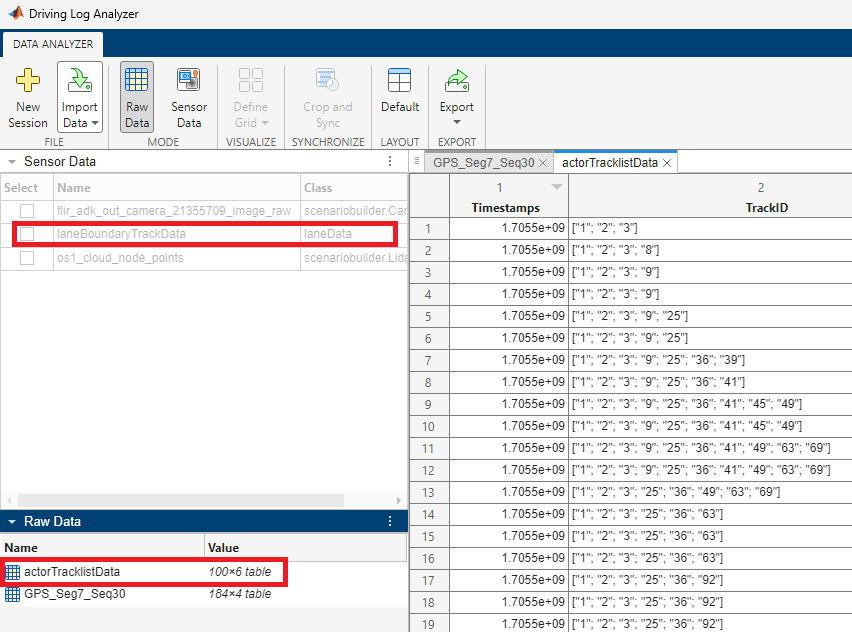
After you import your data, the app lists the raw actor track list data in the Raw Data pane and the lane boundary track data in the Sensor Data pane. The app also displays the actor track list data in a tab of the main pane, as shown in this figure.
Map Raw Sensor Data to Sensor Data Objects
To use raw sensor data with the Scenario Builder for Automated Driving Toolbox support package, you must convert raw data into sensor data objects. The Driving Log Analyzer app enables you to map raw data to sensor data objects, such as GPSData, Trajectory CameraData, LidarData and ActorTrackData, interactively.
Map the raw actorTracklistData data to an ActorTrackData object, actorTrackData.
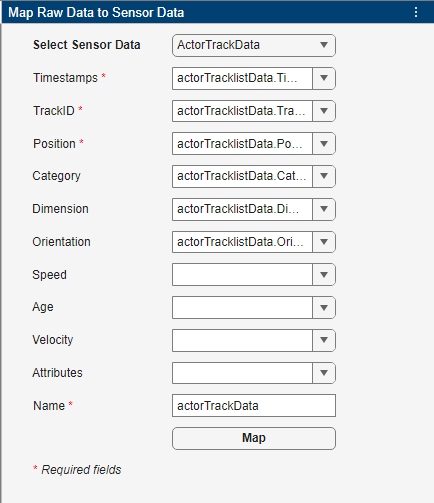
In the Map Raw Data to Sensor Data pane, set Select Sensor Data to ActorTrackData. The app lists the properties of the selected object as fields that you can specify interactively. You must specify at least the fields with a red asterisk to create the sensor data object. To map your raw actor track data to a sensor data object, specify the Timestamps, TrackID, Position, Category, Dimension, and Orientation as these values, and then specify Name as actorTrackData and click Map.
Timestamps —
actorTracklistData.TimestampsTrackID —
actorTracklistData.TrackIDPosition —
actorTracklistData.PositionCategory —
actorTracklistData.CategoryDimension —
actorTracklistData.DimensionOrientation —
actorTracklistData.Orientation
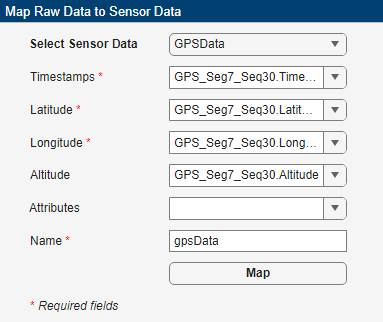
Additionally, map the raw GPS data to a GPSData object. Set Select Sensor Data to GPSData, set Timestamps, Latitude, Longitude, and Altitude to these values, and then specify Name as gpsData and click Map.
Timestamps —
GPS_Seg7_Seq30.TimestampLatitude —
GPS_Seg7_Seq30.LatitudeLongitude —
GPS_Seg7_Seq30.LongitudeAltitude —
GPS_Seg7_Seq30.Altitude
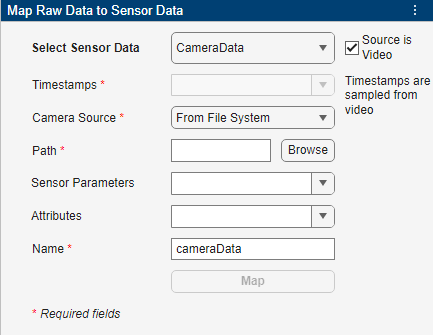
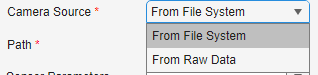
In this example, because you create a camera data object by extracting camera data from a rosbag file, you do not need to manually map raw camera data to sensor data. If you need to create a camera data object from raw data, however, you can set Select Sensor Data to CameraData and specify at least Timestamps, Camera Source, and Path. If your camera data is a video source, however, select Source is Video, which removes Timestamps, as the app instead obtains the timestamps from the video file you specify to Path.
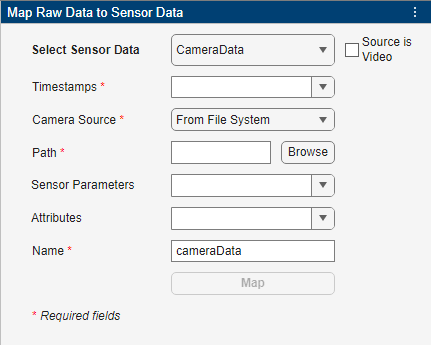
You can specify Camera Source as one of these options:
From File System— Browse for a folder that contains images or a video file.From Raw Data— Specify an imported variable that contains image frames. If you select Source is Video, this option is not available. If you select this option, the app replaces Path with Variable, for field in which you must specify the imported variable that contains the image frames.
After you map your raw data to sensor data objects, on the app toolstrip, select Sensor Data. The app enables the Sensor Data pane. Note that, on the app toolstrip, you can toggle between the Raw Data and Sensor Data modes to visualize the imported raw data and the sensor data objects listed in the Raw Data pane and the Sensor Data pane, respectively.
Visualize Sensor Data Objects
The Driving Log Analyzer app enables you to visualize these sensor data objects: GPSData, Trajectory CameraData, LidarData and ActorTrackData. You can also visualize lane boundary data, imported as a laneData object, in the app.
To visualize the mapped sensor data objects in the app, select them in the Sensor Data pane.
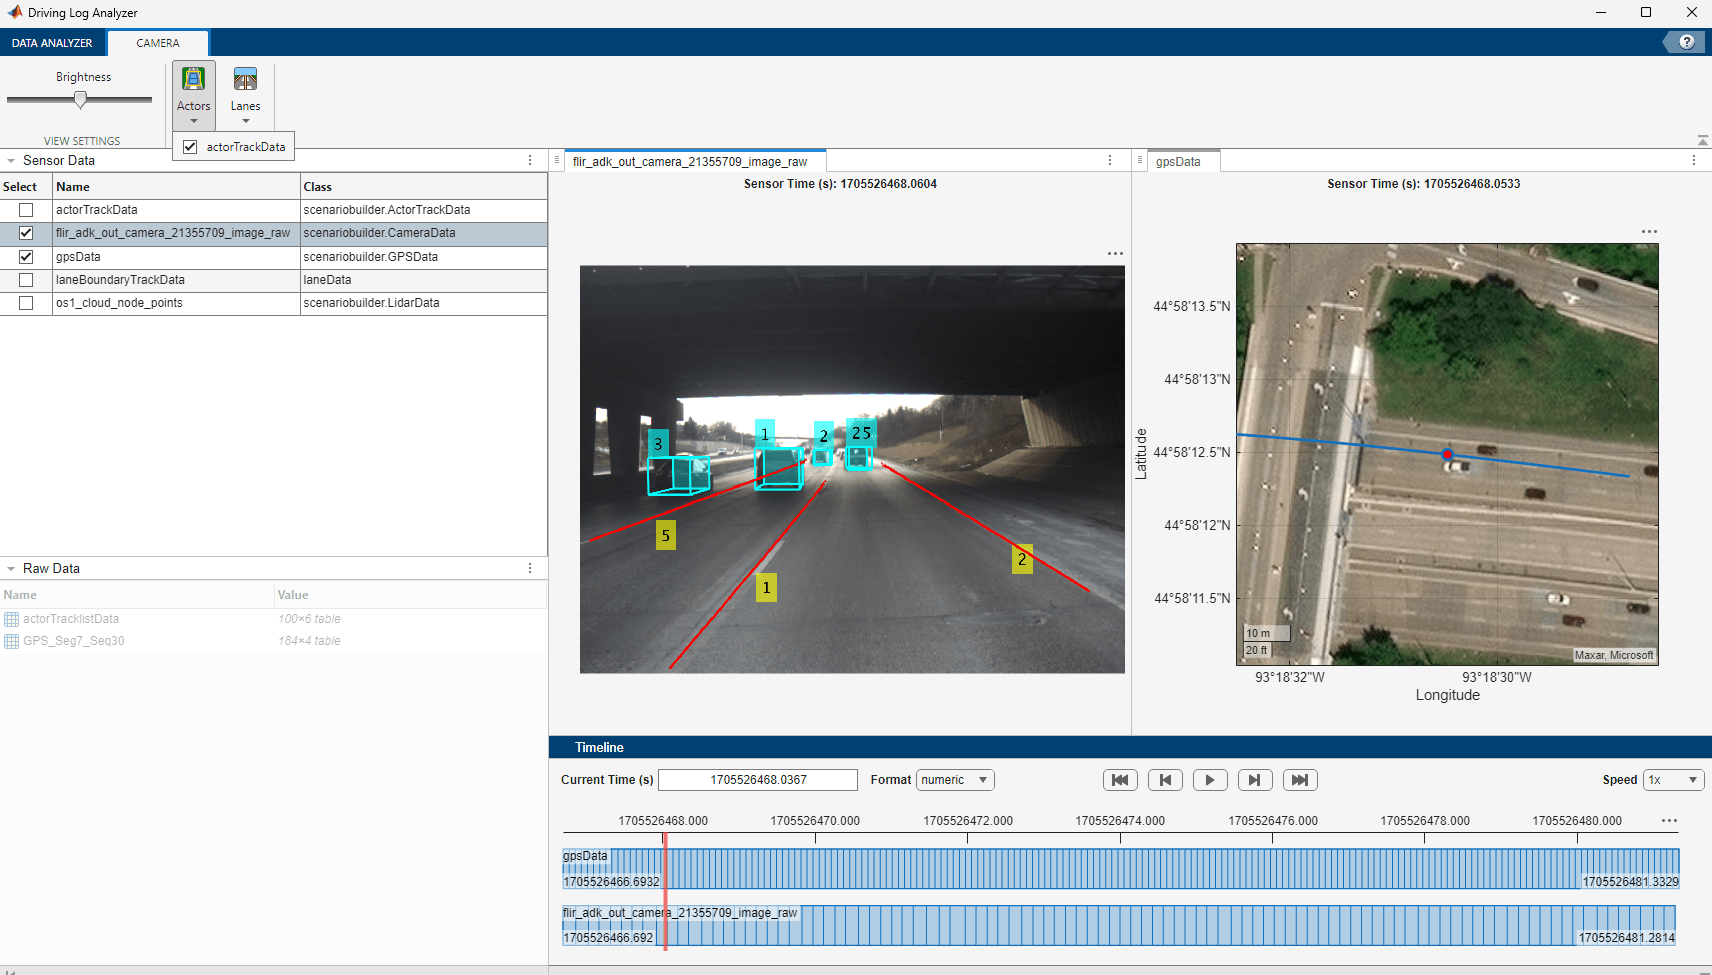
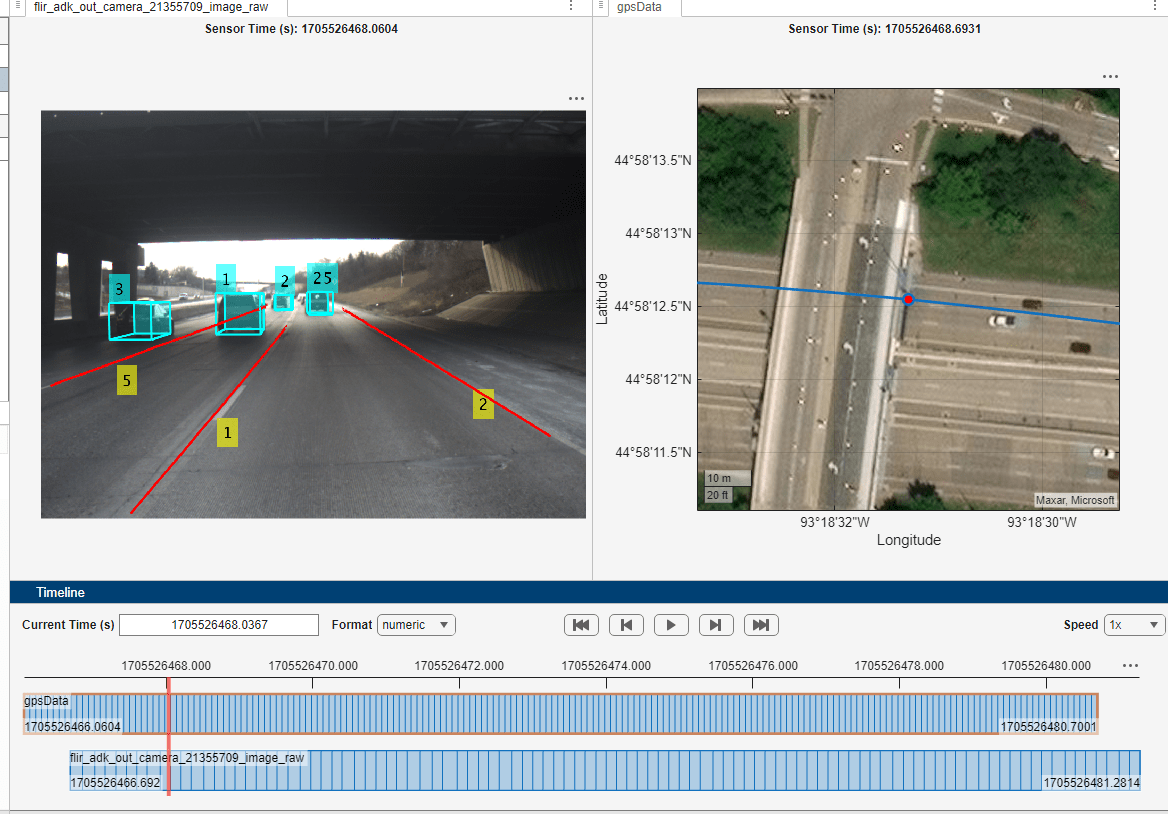
For this example, select the CameraData object flir_adk_out_camera_21355709_image_raw and the GPSData object gpsData. The app displays the figure for each visualization in a separate tab of the main pane.
The Timeline pane displays the timeline of the selected sensor data objects. You can use the playback buttons in the Timeline pane to visualize the data across the timestamps.
To display both visualizations simultaneously, from the app toolstrip, select Display Grid and highlight two squares, then click. The app divides the main pane into two smaller panes, one with the camera data visualization and the other with the GPS data visualization.
To overlay the track data on the camera data, select the tab with the camera visualization, which enables the Camera tab of the app toolstrip. Select Actors, and then select actorTrackData . Then, select Lane and laneBoundaryTrackData.
Select the tab with the GPS data visualization to enable the GPS tab of app toolstrip. On this tab, you can change the base map view of the GPS data, as well as the plot style and zoom level. Note that, by default, Base Map is Satellite.
In this figure, the simulation is paused just as the camera data shows that the ego vehicle is about to enter a bridge underpass. However, in GPS the visualization of the data shows the ego vehicle is multiple car lengths in front of the bridge underpass. This might be due to an offset of the GPS data from the camera data, which you must correct before further processing the data.
Correct Offset of GPS Data
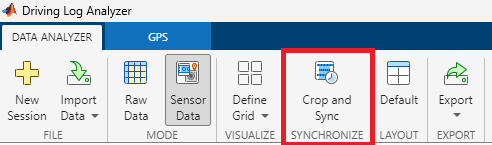
To correct the offset, on the Data Analyzer tab of the app toolstrip, select Crop and Sync.
The app replaces the Data Analyzer tab with a Crop and Sync tab. Note that you can return to the Data Analyzer tab, in the Crop and Sync tab by, clicking Close.
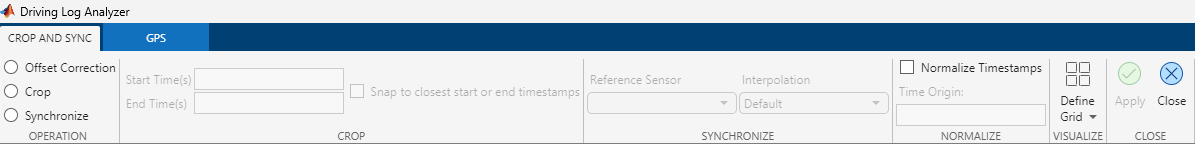
To correct the time offset of the GPS data, in the Operation section of the Crop and Sync tab, select Offset Correction. Then, drag the timeline of the gpsData object to align it with the camera sensor data, which you can confirm by comparing the visualizations of the data. Click Apply in the Crop and Sync tab to correct the time offset of the data.
Crop and Synchronize Sensor Data Objects
To use sensor data objects with the Scenario Builder for Automated Driving Toolbox support package, all of the objects must have data with common start and end timestamps. To ensure they have common start and end timestamps, you must crop the sensor data objects.
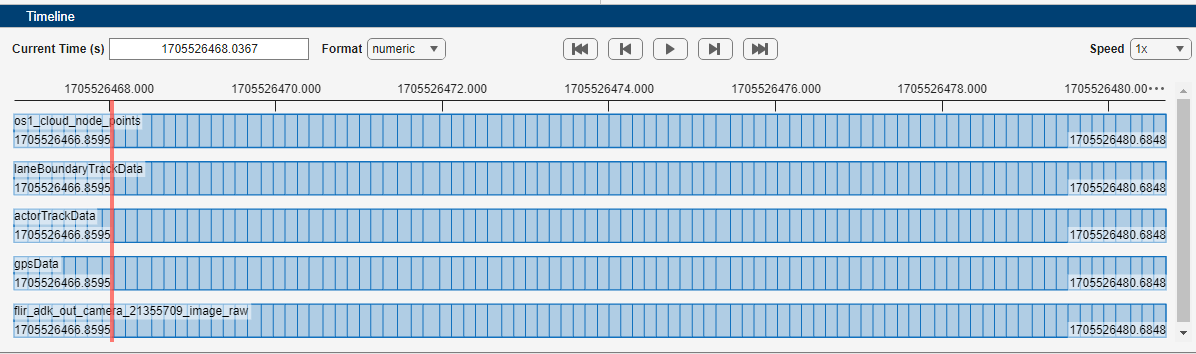
To crop all the sensor data objects, select all sensor data in the Sensor Data pane, and then select Crop in the Crop and Sync tab. Use Start Time(s) and End Time(s) to specify the start time and end time for the crop, respectively. Alternatively, you can set these values by dragging the Start and End timelines in the Timeline pane, as shown in this figure. Click Apply in the Crop and Sync tab to crop the data.
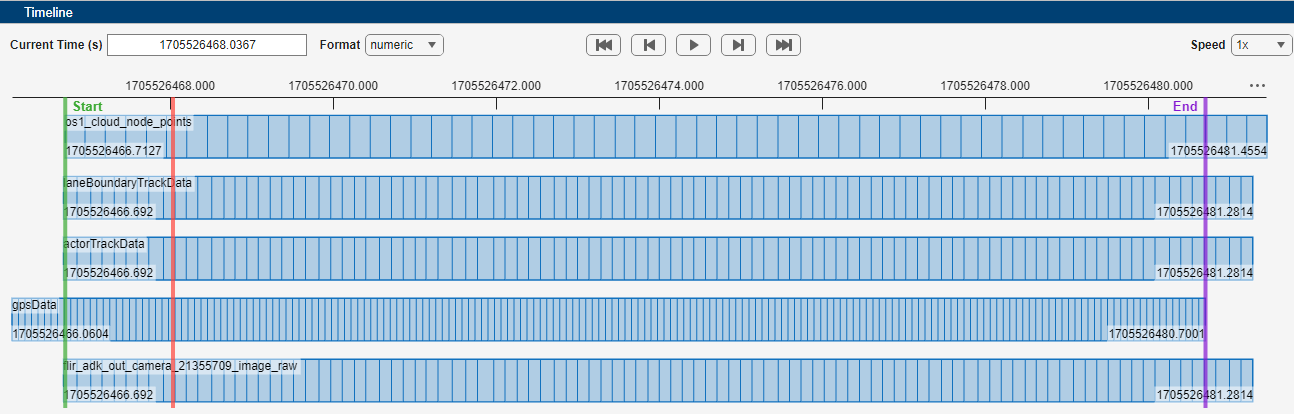
In the Timeline pane, observe that the sensor data objects have different sampling times. To convert all the sensor data to a common sampling rate, you must synchronize them.
To synchronize your data, select Synchronize in the Crop and Sync tab. Then, select a Reference Sensor. For this example, select the camera data object flir_adk_out_camera_21355709_image_raw.
You can specify an interpolation method for each sensor data object by setting the Interpolation option to Custom. If you select Custom, the app enables an additional column in the Sensor Data pane, Interpolation Method, as shown in this figure. You can select an appropriate interpolation method for each sensor data object using the drop-down list in the corresponding row of the Interpolation Method column.
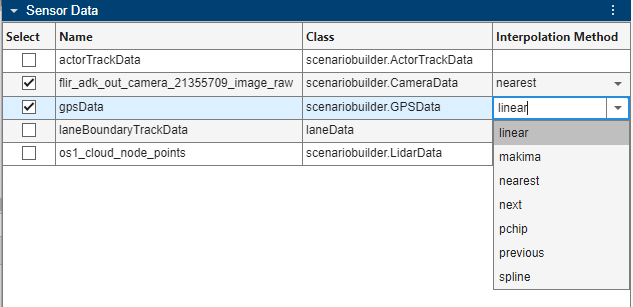
For this example, set Interpolation to Default, and click Apply.
This figure shows the sensor data objects synchronized with the camera data object. Observe that all the sensor data objects have the same number of samples as the camera data object.
Normalize Timestamps of Sensor Data Objects
To normalize the timestamps of the sensor data objects, in the Crop and Sync tab, select Normalize Timestamps and specify a value for Time Origin.
For this example, use the default Time Origin value, and then click Apply to normalize the data.
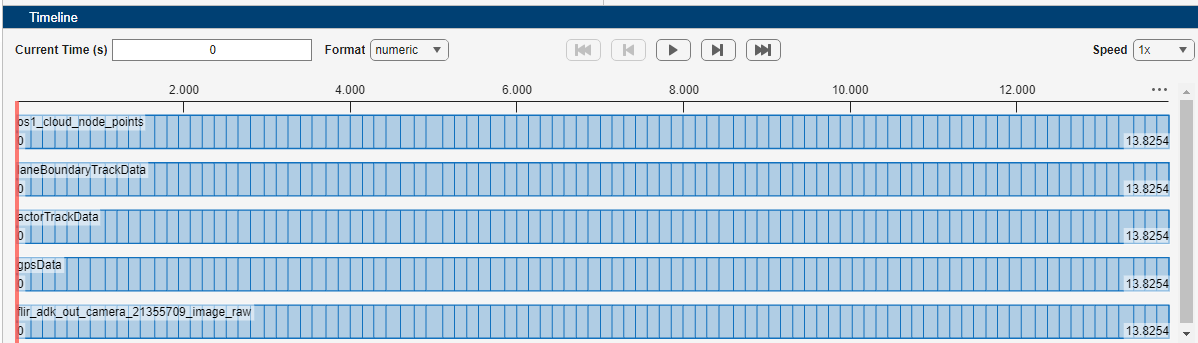
This figure shows the timestamp normalized data. Observe that, for all sensor data objects, the timestamp starts from 0 seconds.
Export Options
The app enables you to export the sensor data objects as a MAT file or to and export them to the MATLAB workspace as objects or timetables. You can also export a script for the operations you performed in this session of the app.
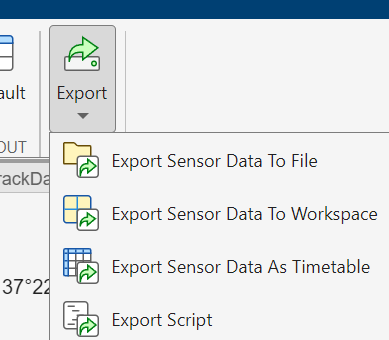
In the Crop and Sync tab of the app toolstrip, click Close. Then, in the Data Analyzer tab, click Export and select one of these options:
Export Sensor Data To File — Exports sensor data objects to a MAT file.
Export Sensor Data To Workspace — Exports sensor data objects to the MATLAB workspace as objects.
Export Sensor Data As Timetable — Exports sensor data objects to the MATLAB workspace as timetables.
Export Script — Exports a script for the operations performed in the current session of the app.
See Also
Objects
GPSData|Trajectory|CameraData|LidarData|ActorTrackData|laneData