Main Content

このページの内容は最新ではありません。最新版の英語を参照するには、ここをクリックします。

plotsom

自己組織化マップのプロット

構文

plotsom(pos)
plotsom(W,D,ND)

説明

plotsom(pos) は、次の 1 つの引数を取ります。

POS

S 個の N 次元ニューロン位置から成る NS 列の行列

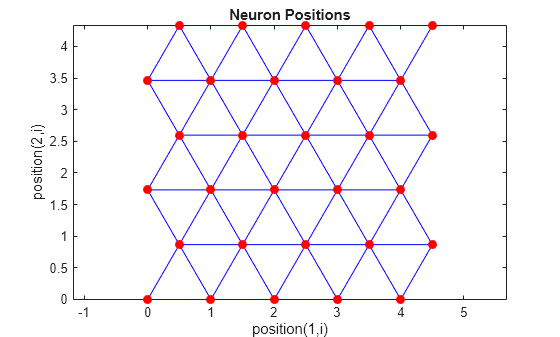
これは、ニューロンの位置を赤い点でプロットし、ユークリッド距離 1 の範囲内にあるニューロンをリンクさせます。

plotsom(W,D,ND) は、3 つの引数を取ります。

W

SR 列の重み行列

D

SS 列の距離行列

ND

近傍距離 (既定は 1)

これは、ニューロンの重みベクトルをプロットし、距離 1 の範囲内にあるニューロンをもつ重みベクトルを接続します。

自己組織化マップのプロット

これらの例では、さまざまな層トポロジのプロットを生成します。

pos = hextop([5 6]); 
plotsom(pos)

Figure contains an axes object. The axes object with title Neuron Positions, xlabel position(1,i), ylabel position(2,i) contains 2 objects of type line. One or more of the lines displays its values using only markers

pos = gridtop([4 5]); 
plotsom(pos)

Figure contains an axes object. The axes object with title Neuron Positions, xlabel position(1,i), ylabel position(2,i) contains 2 objects of type line. One or more of the lines displays its values using only markers

pos = randtop([18 12]); 
plotsom(pos)

Figure contains an axes object. The axes object with title Neuron Positions, xlabel position(1,i), ylabel position(2,i) contains 2 objects of type line. One or more of the lines displays its values using only markers

pos = gridtop([4 5 2]); 
plotsom(pos)

Figure contains an axes object. The axes object with title Neuron Positions, xlabel position(1,i), ylabel position(2,i) contains 2 objects of type line. One or more of the lines displays its values using only markers

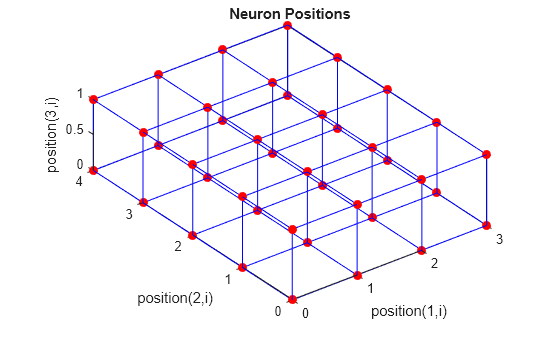
pos = hextop([4 4 3]); 
plotsom(pos)

Figure contains an axes object. The axes object with title Neuron Positions, xlabel position(1,i), ylabel position(2,i) contains 2 objects of type line. One or more of the lines displays its values using only markers

層の重みベクトルおよびそれらがマッピングする入力ベクトルをプロットする例については、plotsompos を参照してください。

バージョン履歴

R2006a より前に導入

参考