チタン テスト データへのスプラインの近似
この例では、Curve Fitting Toolbox™ のコマンドを使用して、ノットの手動選択および自動選択によりチタン テスト データにスプラインを近似する方法を示します。
スプライン内挿のためのノットの手動選択
温度の関数として測定された、チタンの特定のプロパティを記録したデータを次に示します。これを使用して、スプライン内挿の問題について説明します。
[xx,yy] = titanium;
データのプロットには、かなりシャープなピークが示されています。
plot(xx,yy,'bx');
frame = [-10 10 -.1 .3]+[min(xx),max(xx),min(yy),max(yy)];
axis(frame);
内挿が必要なため、これらのやや粗いデータからいくつかのデータ点を選択します。選択したデータ点をマークしたデータを次の図に示します。
pick = [1 5 11 21 27 29 31 33 35 40 45 49];
tau = xx(pick);
y = yy(pick);
hold on
plot(tau,y,'ro');
hold off

n+k 個のノットをもつ次数 k のスプラインの自由度は n であり、データ点の数は 12 であるため、次数が 4 のスプラインによる近似には 12+4 = 16 個のノットが必要です。また、このノット シーケンス t は、i 番目のデータ サイトが i 番目の B スプラインのサポートになるように存在しなければなりません。データ サイトをノットとして使用することでこれを実現しますが、両端に 2 つの単純なノットを追加します。
dl = tau(2) - tau(1);
dr = tau(end) - tau(end-1);
t = [tau(1)-dl*[2 1] tau tau(end)+dr*[1 2]];  % construct the knot sequence
plot(tau,y,'ro');
hold on
axis(frame+[-2*dl 2*dr 0 0])
plot(t,repmat(frame(3)+.03,size(t)),'kx')
hold off
legend({'Data Values' 'Knots'},'location','NW')

このノット シーケンスを使用して、内挿 3 次スプラインを作成します。
sp = spapi(t,tau,y);
ここでプロットを行います。データ区間外のスプライン部分は気にしなくて良いため、プロットをその区間に制限します。
plot(tau,y,'ro')
axis(frame)
hold on
fnplt(sp,[tau(1) tau(end)], 'k')
hold off

スプライン近似の左側をよく見ると、多少波打っているのがわかります。
xxx = linspace(tau(1),tau(5),41);
plot(xxx, fnval(sp, xxx), 'k', tau, y, 'ro');
axis([tau(1) tau(5) 0.6 1.2]);

最初の区間にある不合理なこぶは、スプラインが最初のノットで滑らかに 0 に向かっていることが原因です。これを確認するため、スプライン全体およびそのノット シーケンスとデータ点を次の図に示します。
fnplt(sp,'k');
hold on
plot(tau,y,'ro', t,repmat(.1,size(t)),'kx');
hold off
legend({'Spline Interpolant' 'Data Values' 'Knots'},'location','NW')

次に、より妥当な境界挙動を適用する簡単な方法を示します。指定されたデータ区間の外にデータ点を 2 つ追加し、最初の 2 つのデータ点を通る直線の値をそこでのデータとして選択します。
tt = [tau(1)-[4 3 2 1]*dl tau tau(end)+[1 2 3 4]*dr];
xx = [tau(1)-[2 1]*dl tau tau(end)+[1 2]*dr];
yy = [y(1)-[2 1]*(y(2)-y(1)) y y(end)+[1 2]*(y(end)-y(end-1))];
sp2 = spapi(tt,xx,yy);
plot(tau,y,'ro', xx([1 2 end-1 end]),yy([1 2 end-1 end]),'bo');
axis(frame+[-2*dl 2*dr 0 0]);
hold on
fnplt(sp2,'b',tau([1 end]))
hold off
legend({'Original Data' 'Data Added for End Conditions' ...
        'Fit with Added Data'},'location','NW')

次に、2 つのスプライン近似の比較により、最初と最後の区間のうねりが小さくなっていることを示します。
hold on
fnplt(sp,'k',tau([1 end]))
hold off
legend({'Original Data' 'Data Added for End Conditions' ...
        'Fit with Added Data' 'Original Fit'},'location','NW')

最後に、最初の 4 つのデータ区間を詳しく確認すると、左端付近のうねりが小さくなっていることがよりはっきりとわかります。
plot(tau,y,'ro',xxx,fnval(sp2,xxx),'b',xxx,fnval(sp,xxx),'k');
axis([tau(1) tau(5) .6 1.2]);
legend({'Original Data' 'Fit with Added Data' ...
        'Original Fit'},'location','NW')

内挿のためのノットの自動選択
このような細かい部分を確認する必要がない場合は、Curve Fitting Toolbox でノットを選択することができます。ノット シーケンスではなく、スプライン内挿コマンド spapi の最初の入力引数として、内挿を行う任意の次数を指定します。
autosp = spapi(4, tau, y);
knots = fnbrk(autosp,'knots');
plot(tau, y, 'ro')
hold on
fnplt(autosp,'g')
plot(knots, repmat(.5,size(knots)),'gx')
hold off
legend({'Data Values' 'Fit With Knots Chosen by SPAPI' ...
        'Knots Chosen by SPAPI'}, 'location','NW')

次に、842 でノットを少し右に移動し、985 で少し左に移動して得られた、より適切なノットの選択結果を示します。
knots([7 12]) = [851, 971];
adjsp = spapi(knots, tau, y);
hold on
fnplt(adjsp,'r',2)
plot(knots, repmat(.54,size(knots)),'rx')
hold off
legend({'Data Values' 'Fit With Knots Chosen by SPAPI' ...
        'Knots Chosen by SPAPI' 'Fit With Knots Adjusted' ...
        'Adjusted Knots'}, 'location','NW')

あるいは単純に、csapi で提供される標準の 3 次スプライン内挿を試します。この場合は、やや異なるノットが選択されることになります。
autocs = csapi(tau, y);
plot(tau, y, 'ro')
hold on
fnplt(autocs,'c')
hold off

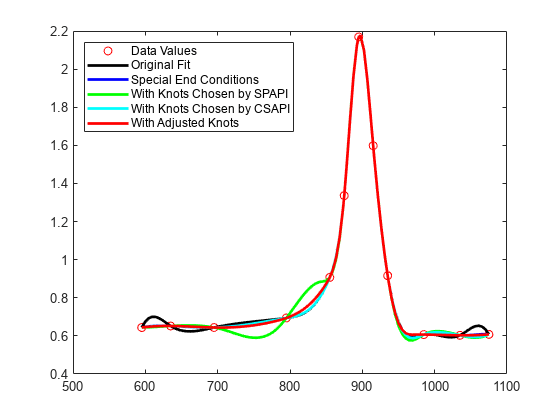
このように急な変化をするデータの場合、どの内挿も 3 次スプラインであったとしても、妥当な内挿をすべて一致させるのは困難です。次のプロットに、比較のために 5 つの内挿をすべて示します。
plot(tau, y, 'ro')
hold on
fnplt(sp,'k',tau([1 end]))  % black: original
fnplt(sp2,'b',tau([1 end])) % blue:  with special end conditions
fnplt(autosp,'g')           % green: automatic knot choice by SPAPI
fnplt(autocs,'c')           % cyan:  automatic knot choice by CSAPI
fnplt(adjsp,'r',2)          % red:   knot choice by SPAPI slightly changed
hold off
legend({'Data Values' 'Original Fit' 'Special End Conditions' ...
        'With Knots Chosen by SPAPI' 'With Knots Chosen by CSAPI' ...
        'With Adjusted Knots'},'location','NW')
