msnorm
Normalize set of signals with peaks
Syntax
Description
yOut = msnorm(X,Intensities)yOut.
[
also returns the normalization parameters yOut,normParams] = msnorm(X,Intensities)normParams, which you can use
to normalize another group of signals.
yOut = msnorm(X,Intensities,NormParameters)NormParameters from a previous
normalization to normalize a new set of signals. The function uses the same parameters to
select the separation-unit positions and output scale from the previous normalization. If
you specified a consensus proportion using the 'Consensus' name-value
pair argument in the previous normalization, the function selects no new separation-unit
positions and performs normalization using the same separation-unit positions.
[___] = msnorm(
uses additional options specified by one or more name-value pair arguments and returns any
of the output arguments in previous syntaxes. For example, X,Intensities,Name,Value)out =
msnorm(X,Y,'Quantile',[0.9 1]) sets the lower (0.9) and upper (1) quantile limit
to use only the largest 10% of intensities in each signal to compute the AUC.
Examples
This example shows how to normalize the area under the curve of every mass spectrum from the mass spec data.
Load a MAT-file, included with the Bioinformatics Toolbox™ software, that contains sample mass spec data, including MZ_lo_res, a vector of m/z values, and Y_lo_res, a matrix of intensity values.
load sample_lo_resCreate a subset (four signals) of the data.
MZ = MZ_lo_res;
Y = Y_lo_res(:,[1 2 5 6]);
Plot the four spectra.
plot(MZ, Y)
axis([-1000 20000 -20 105])
xlabel('Mass-charge Ratio')
ylabel('Relative Ion Intensities')
title('Original Spectra')

Normalize the area under the curve (AUC) of every spectrum to the median, eliminating low-mass (m/z < 1,000) noise, and post-rescaling such that the maximum intensity is 100. Plot the four spectra.
Y1 = msnorm(MZ,Y,'Limits',[1000 inf],'Max',100);
plot(MZ, Y1)
axis([-1000 20000 -20 105])
xlabel('Mass-charge Ratio')
ylabel('Relative Ion Intensities')
title('AUC Normalized Spectra')

This example shows how to normalize the ion intensity of every spectrum from the mass spec data.
Load a MAT-file, included with the Bioinformatics Toolbox™ software, that contains sample mass spec data, including MZ_lo_res, a vector of m/z values, and Y_lo_res, a matrix of intensity values.
load sample_lo_resCreate a subset (four signals) of the data.
MZ = MZ_lo_res;
Y = Y_lo_res(:,[1 2 5 6]);
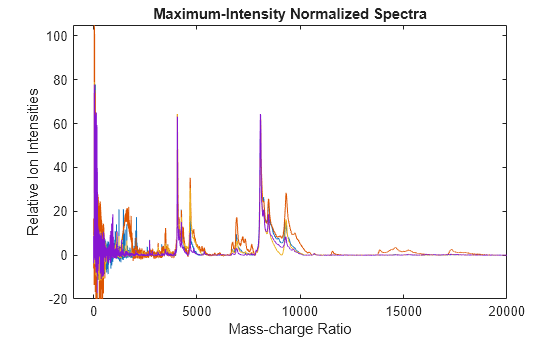
Normalize the ion intensity of every spectrum to the maximum intensity of the single highest peak from any of the spectra in the range above 1000 m/z. Plot the four spectra.
Y2 = msnorm(MZ,Y,'QUANTILE', [1 1],'LIMITS',[1000 inf]);
plot(MZ, Y2)
axis([-1000 20000 -20 105])
xlabel('Mass-charge Ratio')
ylabel('Relative Ion Intensities')
title('Maximum-Intensity Normalized Spectra')
This example shows how to perform quantile normalization for mass spec data.
Load a MAT-file, included with the Bioinformatics Toolbox™ software, that contains sample mass spec data, including MZ_lo_res, a vector of m/z values, and Y_lo_res, a matrix of intensity values.
load sample_lo_resCreate a subset (four signals) of the data.
MZ = MZ_lo_res;
Y = Y_lo_res(:,[1 2 5 6]);
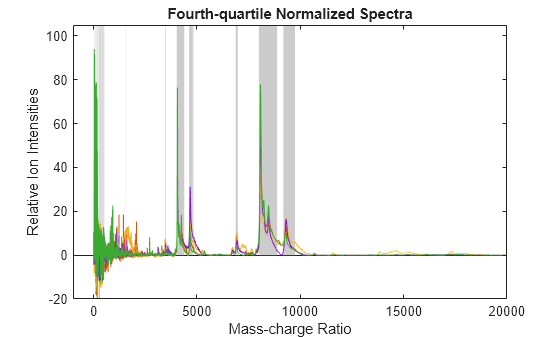
Normalize using the data in the m/z regions where the intensities are within the fourth quartile in at least 90% of the spectrograms. Note that you can use the normalization parameters in the second output to normalize another set of data in the same m/z regions. Plot the four spectra.
[Y3,S] = msnorm(MZ,Y,'Quantile',[0.75 1],'Consensus',0.9);
area(MZ,S.Xh.*1000,'LineStyle','None','FaceColor',[.8 .8 .8])
hold on
plot(MZ, Y3)
hold off
axis([-1000 20000 -20 105])
xlabel('Mass-charge Ratio')
ylabel('Relative Ion Intensities')
title('Fourth-quartile Normalized Spectra')
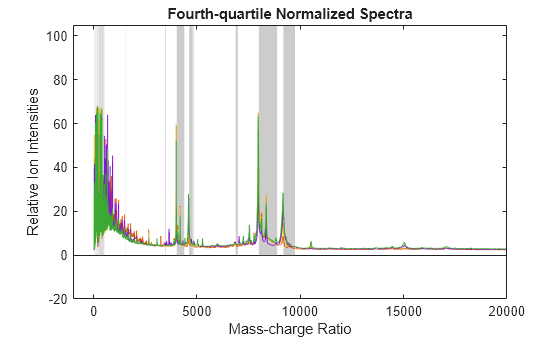
Use the normalization parameters in the second output of the previous step to normalize a different subset of data (four signals) using the data in the same m/z regions as the previous data set. Plot the four spectra.
Y4 = msnorm(MZ,Y_lo_res(:,[3 4 7 8]),S);

area(MZ,S.Xh.*1000,'LineStyle','None','FaceColor',[.8 .8 .8])
hold on
plot(MZ, Y4)
hold off
axis([-1000 20000 -20 105])
xlabel('Mass-charge Ratio')
ylabel('Relative Ion Intensities')
title('Fourth-quartile Normalized Spectra')
Input Arguments
Name-Value Arguments
Output Arguments
Version History
Introduced before R2006a
See Also
mspalign | msbackadj | msdotplot | msalign | msheatmap | mslowess | mspeaks | msresample | msppresample | mssgolay | msviewer
Topics
- Mass Spectrometry and Bioanalytics
- Preprocessing Raw Mass Spectrometry Data
- Visualizing and Preprocessing Hyphenated Mass Spectrometry Data Sets for Metabolite and Protein/Peptide Profiling
- Differential Analysis of Complex Protein and Metabolite Mixtures Using Liquid Chromatography/Mass Spectrometry (LC/MS)