cghcbs
Perform circular binary segmentation (CBS) on array-based comparative genomic hybridization (aCGH) data
Syntax
SegmentStruct = cghcbs(CGHData)


SegmentStruct = cghcbs(CGHData,
...'Alpha', AlphaValue, ...)

SegmentStruct = cghcbs(CGHData,
...'Permutations', PermutationsValue, ...)

SegmentStruct = cghcbs(CGHData,
...'Method', MethodValue, ...)

SegmentStruct = cghcbs(CGHData,
...'StoppingRule', StoppingRuleValue, ...)

SegmentStruct = cghcbs(CGHData,
...'Smooth', SmoothValue, ...)

SegmentStruct = cghcbs(CGHData,
...'Prune', PruneValue, ...)

SegmentStruct = cghcbs(CGHData,
...'Errsum', ErrsumValue, ...)

SegmentStruct = cghcbs(CGHData,
...'WindowSize', WindowSizeValue, ...)

SegmentStruct = cghcbs(CGHData,
...'SampleIndex', SampleIndexValue, ...)

SegmentStruct = cghcbs(CGHData,
...'Chromosome', ChromosomeValue, ...)

SegmentStruct = cghcbs(CGHData,
...'Showplot', ShowplotValue, ...)

SegmentStruct = cghcbs(CGHData,
...'Verbose', VerboseValue, ...)
Input Arguments
CGHData | Array-based comparative genomic hybridization (aCGH) data in
either of the following forms:
|
AlphaValue | Scalar that specifies the significance level for the statistical
tests to accept change points. Default is 0.01. |
PermutationsValue | Scalar that specifies the number of permutations used for p-value
estimation. Default is 10,000. |
MethodValue | Character vector or string that specifies the method to estimate the p-values. Choices are
'Perm' or 'Hybrid'
(default). 'Perm' does a full permutation, while
'Hybrid' uses a faster, tail
probability-based permutation. When using the
'Hybrid' method, the
'Perm' method is applied automatically when
segment data length becomes less than 200. |
StoppingRuleValue | Controls the use of a heuristic stopping rule, based on the
method described by Venkatraman
and Olshen (2007), to declare a change without performing the
full number of permutations for the p-value estimation, whenever it
becomes very likely that a change has been detected. Choices are true or false (default).Tip Set this property to |
SmoothValue | Controls the smoothing of outliers before segmenting using
the procedure explained by Olshen
et al. (2004). Choices are true (default)
or false. |
PruneValue | Controls the elimination of change points identified due to
local trends in the data that are not indicative of real copy number
change, using the procedure explained by Olshen et al. (2004). Choices are true or false (default). |
ErrsumValue | Scalar that specifies the allowed proportional increase in
the error sum of squares when eliminating change points using the 'Prune' property.
Commonly used values are 0.05 and 0.1.
Default is 0.05. |
WindowSizeValue | Scalar that specifies the size of the window (in data points)
used to divide the data when using the 'Perm' method
on large data sets. Default is 200. |
SampleIndexValue | A single sample index or a vector of sample indices that specify the sample(s) to analyze. Default is all sample indices. |
ChromosomeValue | A single chromosome number or a vector of chromosome numbers that specify the data to analyze. Default is all chromosome numbers. |
ShowplotValue | Controls the display of plots of the segment means over the original data. Choices are either:
Default is:
|
VerboseValue | Controls the display of a progress report of the analysis.
Choices are true (default) or false. |
Output Arguments
SegmentStruct | Structure containing segmentation information in the following fields:
|
Description
SegmentStruct = cghcbs(CGHData)
Note
The CBS algorithm recursively splits chromosomes into segments
based on a maximum t statistic estimated by permutation. This computation
can be time consuming. If n = number of
data points, then computation time ~ O(n2).
SegmentStruct = cghcbs(CGHData,
...'PropertyName', PropertyValue,
...)cghcbs with optional properties
that use property name/property value pairs. You can specify one or
more properties in any order. Each PropertyName must
be enclosed in single quotation marks and is case insensitive. These
property name/property value pairs are as follows:
specifies
the significance level for the statistical tests to accept change
points. Default is SegmentStruct = cghcbs(CGHData,
...'Alpha', AlphaValue, ...)0.01.
SegmentStruct = cghcbs(CGHData,
...'Permutations', PermutationsValue, ...)10,000.
SegmentStruct = cghcbs(CGHData,
...'Method', MethodValue, ...)'Perm' or 'Hybrid' (default). 'Perm' does
a full permutation, while 'Hybrid' uses a faster,
tail probability-based permutation. When using the 'Hybrid' method,
the 'Perm' method is applied automatically when
segment data length becomes less than 200.
SegmentStruct = cghcbs(CGHData,
...'StoppingRule', StoppingRuleValue, ...)true or false (default).
SegmentStruct = cghcbs(CGHData,
...'Smooth', SmoothValue, ...)true (default) or false.
SegmentStruct = cghcbs(CGHData,
...'Prune', PruneValue, ...)true or false (default).
SegmentStruct = cghcbs(CGHData,
...'Errsum', ErrsumValue, ...)'Prune' property.
Commonly used values are 0.05 and 0.1.
Default is 0.05.
SegmentStruct = cghcbs(CGHData,
...'WindowSize', WindowSizeValue, ...)'Perm' method on large data sets. Default
is 200.
SegmentStruct = cghcbs(CGHData,
...'SampleIndex', SampleIndexValue, ...)SampleIndexValue,
which can be a single sample index or a vector of sample indices.
Default is all sample indices.
SegmentStruct = cghcbs(CGHData,
...'Chromosome', ChromosomeValue, ...)ChromosomeValue,
which can be a single chromosome number or a vector of chromosome
numbers. Default is all chromosome numbers.
SegmentStruct = cghcbs(CGHData,
...'Showplot', ShowplotValue, ...)true, false, W, S,
or I, an integer specifying one of the
chromosomes in CGHData. When ShowplotValue is true,
all chromosomes in all samples are plotted. If there are multiple
samples in CGHData, then each sample is
plotted in a separate Figure window. When ShowplotValue is W,
the layout displays all chromosomes in one plot in the Figure window.
When ShowplotValue is S,
the layout displays each chromosome in a subplot in the Figure window.
When ShowplotValue is I,
only the specified chromosome is plotted. Default is either:
false— When return values are specified.trueandW— When return values are not specified.
SegmentStruct = cghcbs(CGHData,
...'Verbose', VerboseValue, ...)true (default)
or false.
Examples
Analyze data from the Coriell cell line study
Load the array-based CGH (aCGH) data from the Coriell cell line study (Snijders, A. et al., 2001).
load coriell_baccgh
Analyze all chromosomes of sample 3 (GM05296) of the aCGH data and return segmentation data in a structure, S. Plot the segment means over the original data for all chromosomes of this sample.
S = cghcbs(coriell_data,'sampleindex',3,'showplot',true);
Analyzing: GM05296. Current chromosome 1
Analyzing: GM05296. Current chromosome 2
Analyzing: GM05296. Current chromosome 3
Analyzing: GM05296. Current chromosome 4
Analyzing: GM05296. Current chromosome 5
Analyzing: GM05296. Current chromosome 6
Analyzing: GM05296. Current chromosome 7
Analyzing: GM05296. Current chromosome 8
Analyzing: GM05296. Current chromosome 9
Analyzing: GM05296. Current chromosome 10
Analyzing: GM05296. Current chromosome 11
Analyzing: GM05296. Current chromosome 12
Analyzing: GM05296. Current chromosome 13
Analyzing: GM05296. Current chromosome 14
Analyzing: GM05296. Current chromosome 15
Analyzing: GM05296. Current chromosome 16
Analyzing: GM05296. Current chromosome 17
Analyzing: GM05296. Current chromosome 18
Analyzing: GM05296. Current chromosome 19
Analyzing: GM05296. Current chromosome 20
Analyzing: GM05296. Current chromosome 21
Analyzing: GM05296. Current chromosome 22
Analyzing: GM05296. Current chromosome 23
Analyzing: GM05296. Current chromosome 26
Analyzing: GM05296. Current chromosome 27
Analyzing: GM05296. Current chromosome 30
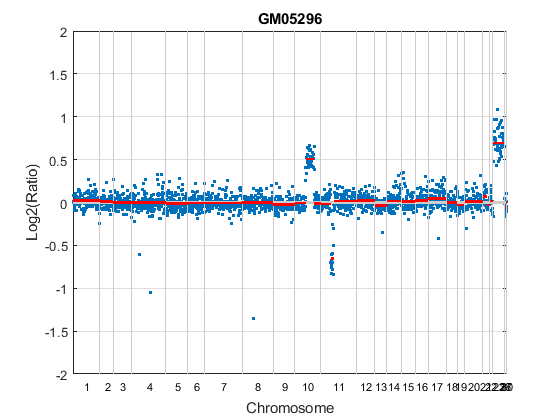
Chromosome 10 shows a gain, while chromosome 11 shows a loss.
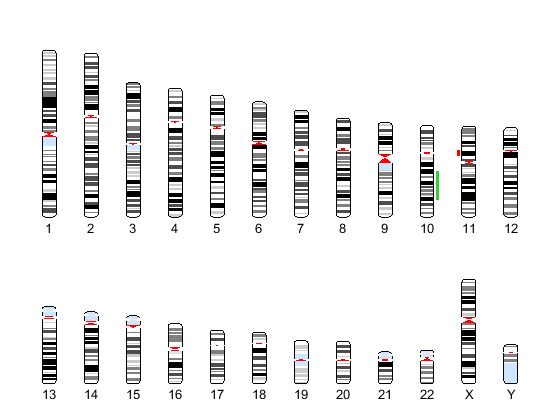
Display copy number alteration regions aligned to a chromosome ideogram
Create a structure containing segment gain and loss information for chromosomes 10 and 11 from sample 3, making sure the segment data is in bp units. (You can determine copy number variance (CNV) information by exploring S, the structure of segments returned by the cghcbs function. For the 'CNVType' field, use 1 to indicate a loss and 2 to indicate a gain.
cnvStruct = struct('Chromosome', [10 11],...
 'CNVType', [2 1],...
 'Start', [S.SegmentData(10).Start(2),...
  S.SegmentData(11).Start(2)]*1000,...
 'End',   [S.SegmentData(10).End(2),...
  S.SegmentData(11).End(2)]*1000)
cnvStruct =

  struct with fields:

    Chromosome: [10 11]
       CNVType: [2 1]
         Start: [66905000 35416000]
           End: [110412000 43357000]
Pass the structure to the chromosomeplot function using the 'CNV' option to display the copy number gains (green) and losses (red) aligned to the human chromosome ideogram. Specify kb units for the display of segment information in the data tip.
chromosomeplot('hs_cytoBand.txt', 'CNV', cnvStruct, 'unit', 2)
Analyze data from a pancreatic cancer study
Load the aCGH data from a pancreatic cancer study (Aguirre, A. et al., 2004).
load pancrea_oligocgh
Analyze only chromosome 9 in sample 32 of the CGH data and return the segmentation data in a structure, PS. Plot the segment means over the original data for chromosome 9 in this sample.
PS = cghcbs(pancrea_data,'sampleindex',32,'chromosome',9,...
            'showplot',9);
Analyzing: PA.T.7692.redo. Current chromosome 9
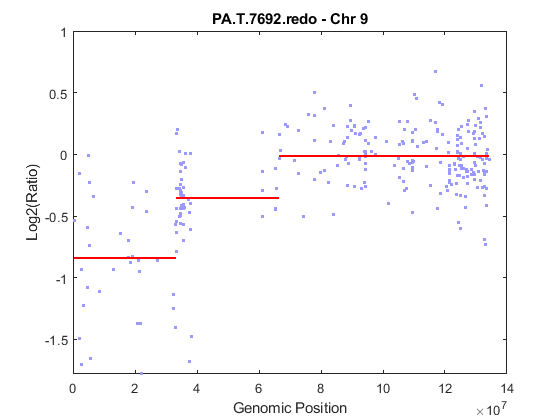
Chromosome 9 contains two segments that indicate losses. For more detailed information on interpreting the data, see Aguirre, A. et al. (2004).
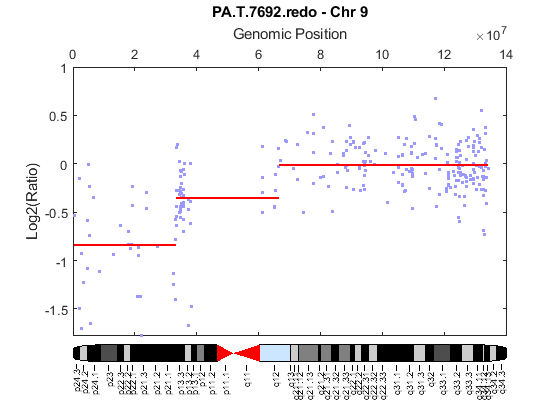
Use the chromosomeplot function with the 'addtoplot' option to add the ideogram of chromosome 9 for Homo sapiens to the plot of the segmentation data.
chromosomeplot('hs_cytoBand.txt', 9, 'addtoplot', gca)
References
[1] Olshen, A.B., Venkatraman, E.S., Lucito, R., and Wigler, M. (2004). Circular binary segmentation for the analysis of array-based DNA copy number data. Biostatistics 5, 4, 557–572.
[2] Venkatraman, E.S., and Olshen, A.B. (2007). A Faster Circular Binary Segmentation Algorithm for the Analysis of Array CGH Data. Bioinformatics 23(6), 657–663.
[3] Venkatraman, E.S., and Olshen, A.B. (2006). DNAcopy: A Package for
Analyzing DNA Copy Data. https://www.bioconductor.org/packages/2.1/bioc/html/DNAcopy.html
[4] Snijders, A.M., Nowak, N., Segraves, R., Blackwood, S., Brown, N., Conroy, J., Hamilton, G., Hindle, A.K., Huey, B., Kimura, K., Law, S., Myambo, K., Palmer, J., Ylstra, B., Yue, J.P., Gray, J.W., Jain, A.N., Pinkel, D., and Albertson, D.G. (2001). Assembly of microarrays for genome-wide measurement of DNA copy number. Nature Genetics 29, 263–264.
[5] Aguirre, A.J., Brennan, C., Bailey, G., Sinha, R., Feng, B., Leo, C., Zhang, Y., Zhang, J., Gans, J.D., Bardeesy, N., Cauwels, C., Cordon-Cardo, C., Redston, M.S., DePinho, R.A., and Chin, L. (2004). High-resolution characterization of the pancreatic adenocarcinoma genome. PNAS 101, 24, 9067–9072.
Version History
Introduced in R2007b