Main Content

uiaeroegt

Create exhaust gas temperature (EGT) indicator component

Description

example

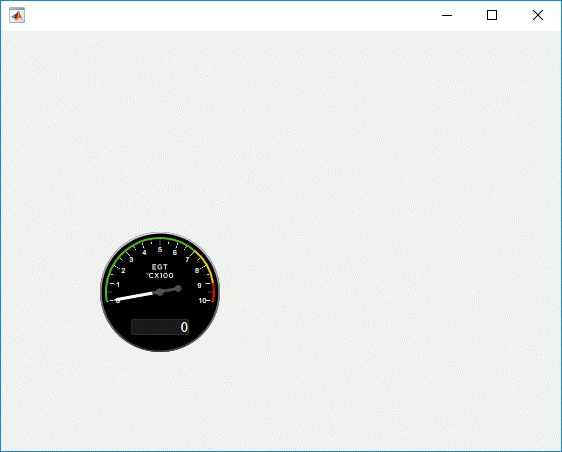
egt = uiaeroegt creates an EGT indicator in a new figure. MATLAB® calls the uifigure function to create the figure.

The EGT indicator displays temperature measurements for engine exhaust gas temperature (EGT) in Celsius.

This gauge displays values using both:

  • A needle on a gauge. A major tick is (Maximum-Minimum)/1,000 degrees, a minor tick is (Maximum-Minimum)/200 degrees Celsius.

  • A numeric indicator. The operating range for the indicator goes from Minimum to Maximum degrees Celsius.

If the value of the input is under Minimum, the needle displays 5 degrees under the Minimum value, the numeric display shows the Minimum value. If the value exceeds the Maximum value, the needle displays 5 degrees over the maximum tick, and the numeric displays the Maximum value.

Note

Use this function only with figures created using the uifigure function. Apps created using GUIDE or the figure function do not support flight instrument components.

example

egt = uiaeroegt(parent) specifies the object in which to create the EGT indicator.

egt = uiaeroegt( ___ ,Name,Value) specifies EGT indicator properties using one or more Name,Value pair arguments. Use this option with any of the input argument combinations in the previous syntaxes.

Examples

collapse all

Create an EGT indicator component named egt. By default, the function creates a uifigure object for the indicator object.

egt = uiaeroegt
egt = 

  EGTIndicator (0) with properties:

         Temperature: 0
         ScaleColors: [3×3 double]
    ScaleColorLimits: [3×2 double]
              Limits: [0 1000]
            Position: [100 100 120 120]

  Show all properties

Create a figure window to contain the EGT indicator component, then create an EGT indicator component named egt.

f = uifigure;
egt = uiaeroegt(f)
egt = 

  EGTIndicator (0) with properties:

         Temperature: 0
         ScaleColors: [3×3 double]
    ScaleColorLimits: [3×2 double]
              Limits: [0 1000]
            Position: [100 100 120 120]

  Show all properties

Input Arguments

collapse all

Parent container, specified as a Figure object created using the uifigure function or one of its child containers: Tab, Panel, ButtonGroup, or GridLayout. If you do not specify a parent container, MATLAB calls the uifigure function to create a new Figure object that serves as the parent container.

Name-Value Arguments

Specify optional pairs of arguments as Name1=Value1,...,NameN=ValueN, where Name is the argument name and Value is the corresponding value. Name-value arguments must appear after other arguments, but the order of the pairs does not matter.

Before R2021a, use commas to separate each name and value, and enclose Name in quotes.

For a full list of EGT indicator properties and descriptions for each type, see EGTIndicator Properties.

Output Arguments

collapse all

EGT indicator component, returned as an object.

Version History

Introduced in R2018b