このページは前リリースの情報です。該当の英語のページはこのリリースで削除されています。
単相線路の時間領域と周波数領域のテスト
この例では、分布定数線路モデルとπ型セクション線路モデルの時間領域と周波数領域での性能を示します。
G. Sybille (Hydro-Quebec)

説明
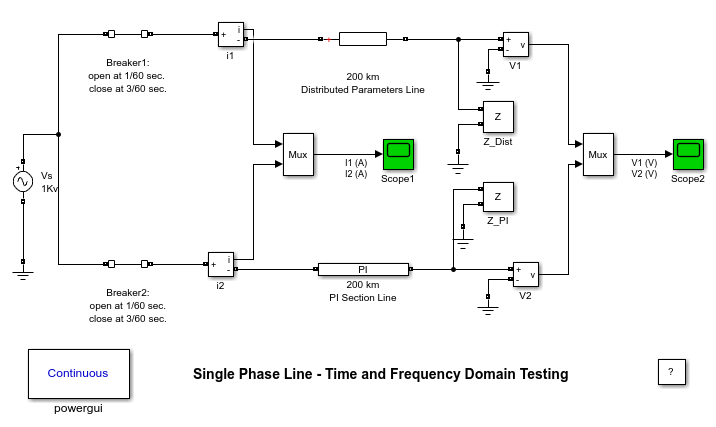
200 km の送電線が 1 kV、60 Hz の無限電源に接続されています。送電が停止され、2 サイクル後に再送電されます。シミュレーションは 2 つの異なる線路モデルで同時に実行されます。
- 分布定数線路
- 2 つの 100 km セクションで構成されるπ型セクション線路
送電端の電流と受電端の電圧が 2 つの線路モデルで比較されます。周波数応答を比較するために、Impedance Measurement ブロックが両方の線路の開放端に接続されています。
シミュレーション
1. 定常状態
Powergui ブロックから [Steady-State Voltages and Currents] を選択して、電圧と電流の位相ベクトルを表示します。2 つのモデルで取得された値が同じであることを観察します。
2. 時間領域の比較
2 つのスコープを開き、シミュレーションを開始します。ブレーカーが開いたときと再度閉じたときの電流と電圧の波形の違いを観察します。分布定数モデルの鋭いエッジに注目してください。線路の末端における進行波反射によって発生するこれらの電圧および電流のステップ信号は、π モデルではフィルター処理されます。
3. 周波数領域の比較
Powergui ブロックを開いて、[Impedance vs Frequency Measurement] を選択します。新規ウィンドウが開き、現在の回路に接続された 2 つの Impedance Measurement ブロック (Z_Dist と Z_PI) がリストされます。2 Hz の間隔で、0:2000 Hz 周波数範囲でインピーダンスを計算するようパラメーターが設定されていることにも注目してください。Ctrl キーを使用して、右上のウィンドウで Z_Dist と Z_PI を両方とも選択します。次に、[更新] ボタンをクリックします。2 つのインピーダンスが計算され、同じグラフにプロットされます。
分布定数線路では、極と零点が 486 Hz ごとに連続して均等にプロットされていることに注目してください。最初の極は 243 Hz で発生し、周波数 f = 1 / (4*T) に対応します。詳細を以下に示します。
T = travelling time = length*sqrt(L*C) = 200*sqrt(2.137e-3*12.37e-9) = 1.028 ms
π型セクション線路は 2 つのπ型セクションで構成されるので、π型セクション線路で表示されるのは 2 つの極だけです。インピーダンスの比較では、2 つの π 型線路によって 0 ~ 350 Hz の周波数範囲に対して分布定数線路の良好な近似が得られることがわかります。