Debug SimEvents Models
A breakpoint is a point of interest in the simulation at which the debugger can suspend the simulation. SimEvents® Debugger allows you to inspect entities, set breakpoints based on entities leaving or entering storage elements, and step to events.
To enable debugging for a SimEvents model, add the SimEvents Debugger block to the model. When you click Step Forward in the Simulink® Toolstrip, the SimEvents Debugger displays.
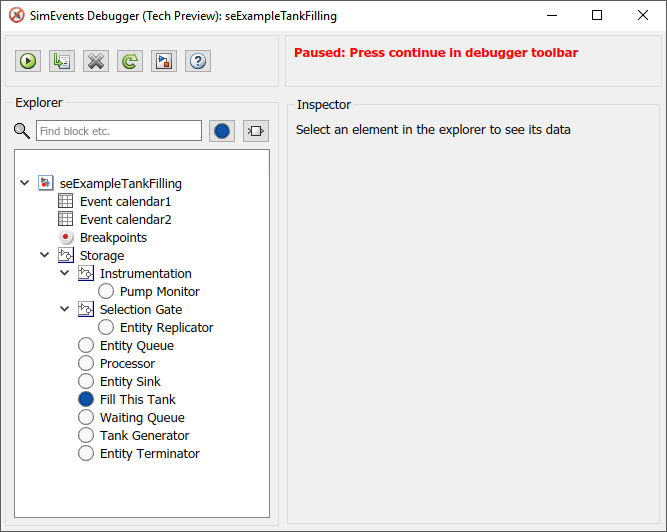
The Explorer pane contains these nodes:
Event calendar — Maintains a list of current and pending events for the model. Select the Break before event execution check box to display event breakpoints on the Breakpoints node.
Breakpoints — Lists the breakpoints previously set for the model. You can view breakpoints set for the block, on event calendar, and for watched entities.
Storage — Displays the entity inspector listing all the storage blocks in the model and check boxes that let you select breakpoints. Blocks that contain entities are denoted with
 .
.To set breakpoints for post entry and pre-exit of entities, select the PostEntry Break and PreExit Break check boxes.
Entity Queue — Displays the entity inspector listing the entities and attributes associated with that block.
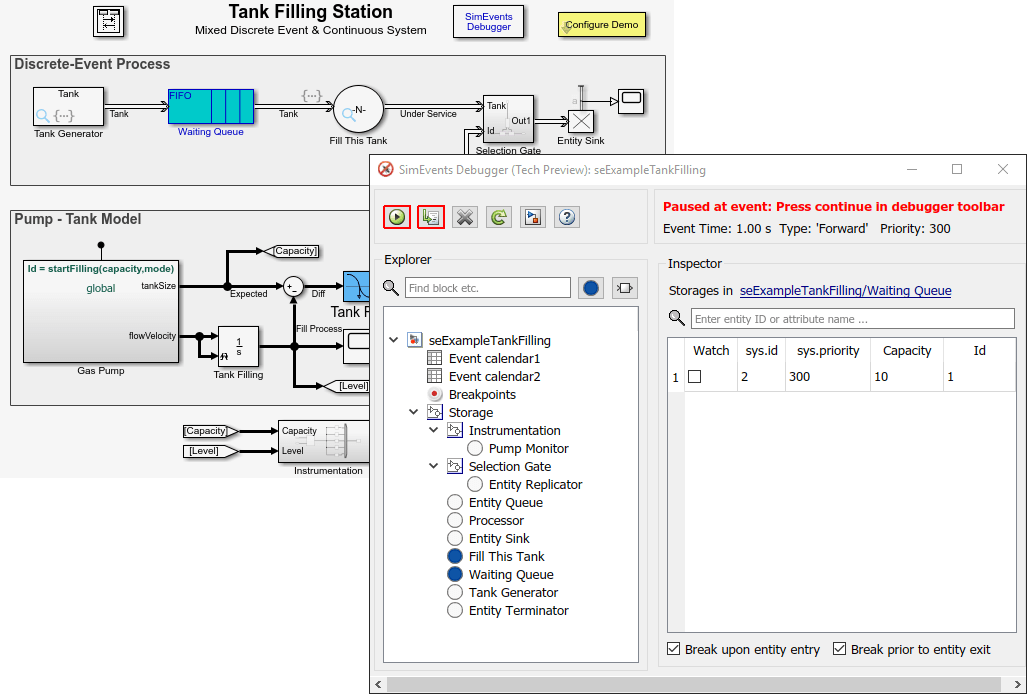
SimEvents Debugger is used in the Modeling Hybrid Systems - Tank Filling example to step through the model simulation, to set breakpoints, and to explore the event calendar.
The SimEvents software also provides an API that helps you to create your own visualization and debugging tools. For more information, see Use SimulationObserver Class to Monitor a SimEvents Model.
Start the Debugger
Open the Modeling Hybrid Systems - Tank Filling example.
Into the Simulink editor, add the SimEvents Debugger block at the top of the
Tank Filling Stationmodel.To start the debugger, in the Simulink editor toolstrip, click the Step Forward button.
The debugger displays in a paused state.
To step to the next event, click
 .
.Note
You can also click Continue (
 ) to have the debugger continue the
simulation. However, doing so without setting breakpoints causes the
simulation to complete and the debugger to close.
) to have the debugger continue the
simulation. However, doing so without setting breakpoints causes the
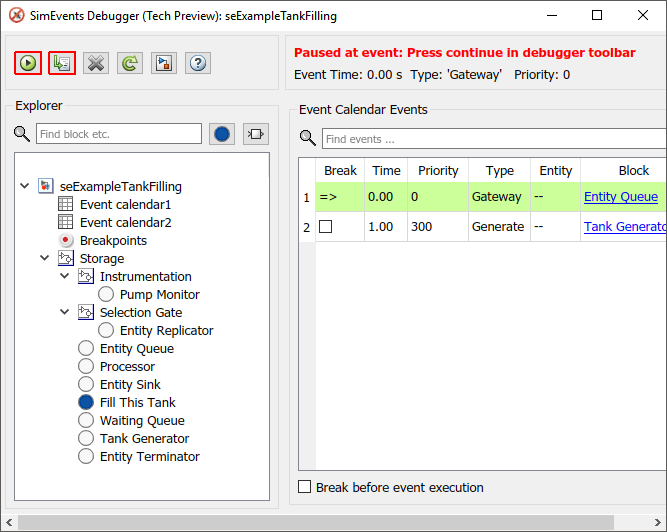
simulation to complete and the debugger to close.The debugger pauses at the next event and displays it in the event calendar. The current event is highlighted in green.

Step Through Model
To look at the current and scheduled events, click the Event calendar1 item. To set breakpoints, you can select the Break before event execution check box. The debugger hits the breakpoint before the next scheduled event. This breakpoint is for any event type, including Forward, Generate, ServiceComplete, Gateway, Destroy, and Trigger. Do not select this check box now.
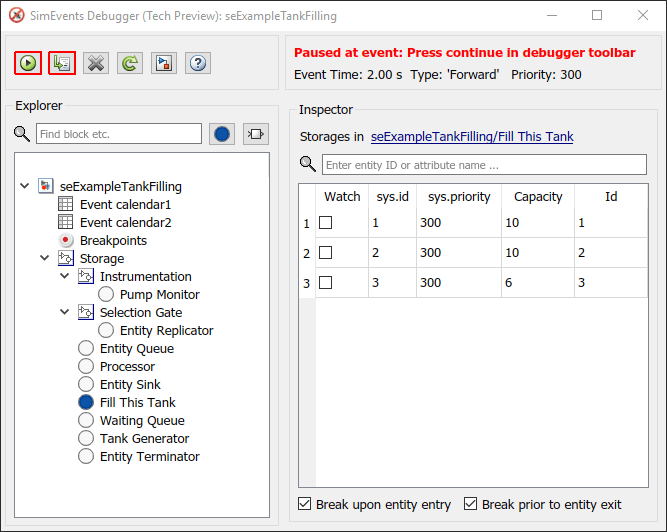
To inspect the attributes of an entity, click the Fill This Tank storage element in the Explorer pane.

The Inspector pane shows a table with the entity
sys.id. To track the entity as the model simulates, click the associated check box.To set breakpoints for when this entity enters and leaves the block, at the bottom of the Inspector pane, select the two check boxes Break upon entity entry and Break prior to entity exit.
Alternatively, to set the breakpoints on storage blocks all at once, click the Storage item in the Explorer pane. Notice that the Fill This Tank block is highlighted because it contains entities.
Select the PostEntry Break check boxes for the blocks you want in this table.
To progress to the next event, click
.Click Continue. Simulation continues until the next
PostEntryorPreExitevent.
The block associated with the breakpoint is highlighted.
Step to the next event.
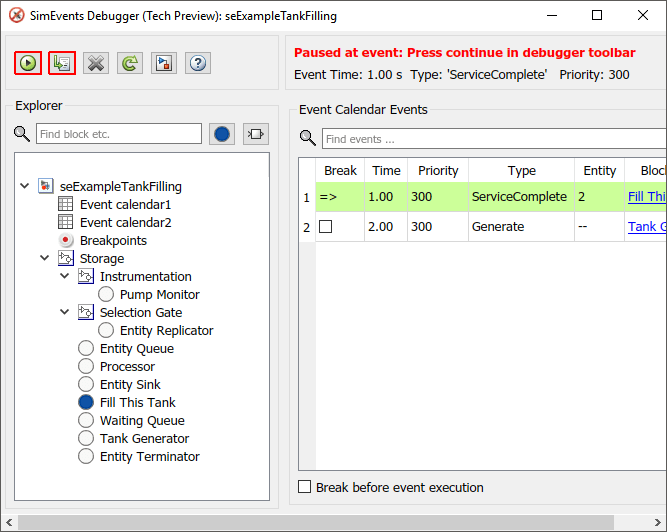
The next breakpoint at which the debugger stops is highlighted in the event calendar.
Continue the simulation.
The simulation stops at the entity you opted to watch. As you continue the simulation or step through the model, the debugger stops at the various breakpoints and watchpoints that you set, letting you explore the model simulation.
To inspect the entities in a currently selected block in the model, select the block in the model, then click the Inspect GCB button (
 ).
).The Inspector pane displays the current details of the entities in this block.
You can continue to set entity watchpoints and event breakpoints.
To list select blocks, events, or entities, type their names in the search boxes at the top of the Explorer or Inspector panes.
The SimEvents software also provides a programmatic interface that lets you create your own simulation observer or debugger. For more information, see Create Custom Visualization.