イメージへのハイパーリンク
この例では、イメージ内の領域をハイパーリンクとして定義する方法を示します。ハイパーリンクを定義して、ターゲット Web ページにリンクしたり、同じレポート内の別の場所に移動したりできます。
長い完全修飾クラス名を使用せずに済むよう、DOM およびレポートの API パッケージをインポートします。
import mlreportgen.dom.*
import mlreportgen.report.*
レポートを作成して開きます。
% To create an HTML report, change "pdf” to “html” or "html-file" for a
% multifile or single-file report, respectively.
rpt = Report("myreport","pdf");
open(rpt);
レポートに段落を追加します。
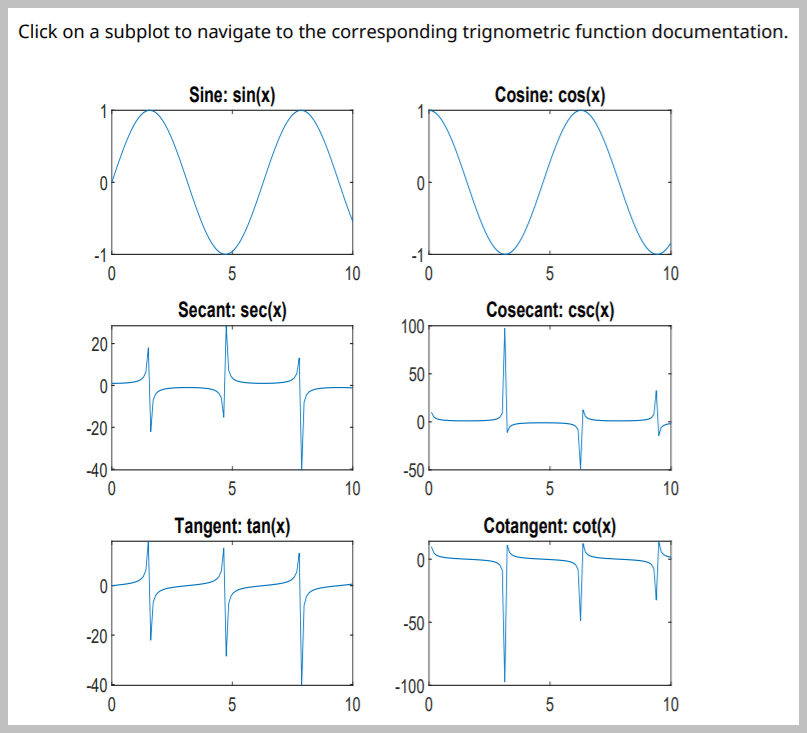
content = "Click on a subplot to navigate to the corresponding " + ...
    "trigonometric function documentation.";
add(rpt,Paragraph(content));
さまざまな三角関数の複数のサブプロットを含む Figure を作成します。
figH = figure;
x = linspace(0,10);

sinePlot = subplot(3,2,1,"Units","pixels");
plot(x,sin(x));
title("Sine: sin(x)");

cosinePlot = subplot(3,2,2,"Units","pixels");
plot(x,cos(x));
title("Cosine: cos(x)");

secantPlot = subplot(3,2,3,"Units","pixels");
plot(x,sec(x));
title("Secant: sec(x)");

cosecantPlot = subplot(3,2,4,"Units","pixels");
plot(x,csc(x));
title("Cosecant: csc(x)");

tangentPlot = subplot(3,2,5,"Units","pixels");
plot(x,tan(x));
title("Tangent: tan(x)");

cotangentPlot = subplot(3,2,6,"Units","pixels");
plot(x,cot(x));
title("Cotangent: cot(x)");
"Figure" レポーターを使用して、Figure のスナップショットを取得します。DOM の "Image" を使用して、スナップショットをレポートに含めます。
figReporter = Figure("Source",figH,"SnapshotFormat","jpg");
imgPath = getSnapshotImage(figReporter,rpt);

figImg = Image(imgPath);
各サブプロットのイメージ領域を使用して、スナップショット上にイメージ マップを作成します。この例の最後に定義されている関数 "getCoords" は、各サブプロットの座標を取得します。サブプロット イメージ領域のターゲットは、そのサブプロットを作成するために使用される三角関数のドキュメンテーション Web ページに設定されます。次に、スナップショットをレポートに追加します。
map = ImageMap;

sinePlotCoords = getCoords(sinePlot);
sinePlotArea = ImageArea("https://www.mathworks.com/help/matlab/ref/sin.html", ...
    "Sine",sinePlotCoords);
append(map,sinePlotArea);

cosinePlotCoords = getCoords(cosinePlot);
cosinePlotArea = ImageArea("https://www.mathworks.com/help/matlab/ref/cos.html", ...
    "Cosine",cosinePlotCoords);
append(map,cosinePlotArea);

secantPlotCoords = getCoords(secantPlot);
secantPlotArea = ImageArea("https://www.mathworks.com/help/matlab/ref/sec.html", ...
    "Secant",secantPlotCoords);
append(map,secantPlotArea);

cosecantPlotCoords = getCoords(cosecantPlot);
cosecantPlotArea = ImageArea("https://www.mathworks.com/help/matlab/ref/csc.html", ...
    "Cosecant",cosecantPlotCoords);
append(map,cosecantPlotArea);

tangentPlotCoords = getCoords(tangentPlot);
tangentPlotArea = ImageArea("https://www.mathworks.com/help/matlab/ref/tan.html", ...
    "Tangent",tangentPlotCoords);
append(map,tangentPlotArea);

cotangentPlotCoords = getCoords(cotangentPlot);
cotangentPlotArea = ImageArea("https://www.mathworks.com/help/matlab/ref/cot.html", ...
    "Cotangent",cotangentPlotCoords);
append(map,cotangentPlotArea);

figImg.Map = map;
add(rpt,figImg);
Figure ウィンドウを削除します。レポートを閉じて表示します。
close(rpt);
delete(figH);
rptview(rpt);
以下の関数は、親 Figure の指定されたサブプロットの左上と右下の座標を計算して返します。この座標は、左下を基準点とする Figure 座標系に基づくサブプロットの座標軸座標を、イメージの左上を基準点とする DOM "ImageArea" 座標系に変換することで算出されます。
function coords = getCoords(subplot)
    subplotWidth = subplot.Position(3);
    subplotHeight = subplot.Position(4);

    fig = subplot.Parent;
    figHeight = fig.Position(4);

    x1 = subplot.Position(1);
    y1 = figHeight - (subplot.Position(2) + subplotHeight);

    x2 = x1 + subplotWidth;
    y2 = y1 + subplotHeight;

    coords = [x1, y1, x2, y2];
end