UWB Bandpass Filter Using Open and Short-Circuited Stubs
This example shows how to create an open or short circuited stub filter using the filterStub catalog and analyze the filter using RF PCB Toolbox.
UWB 5-Pole Short Circuited Bandpass Filter
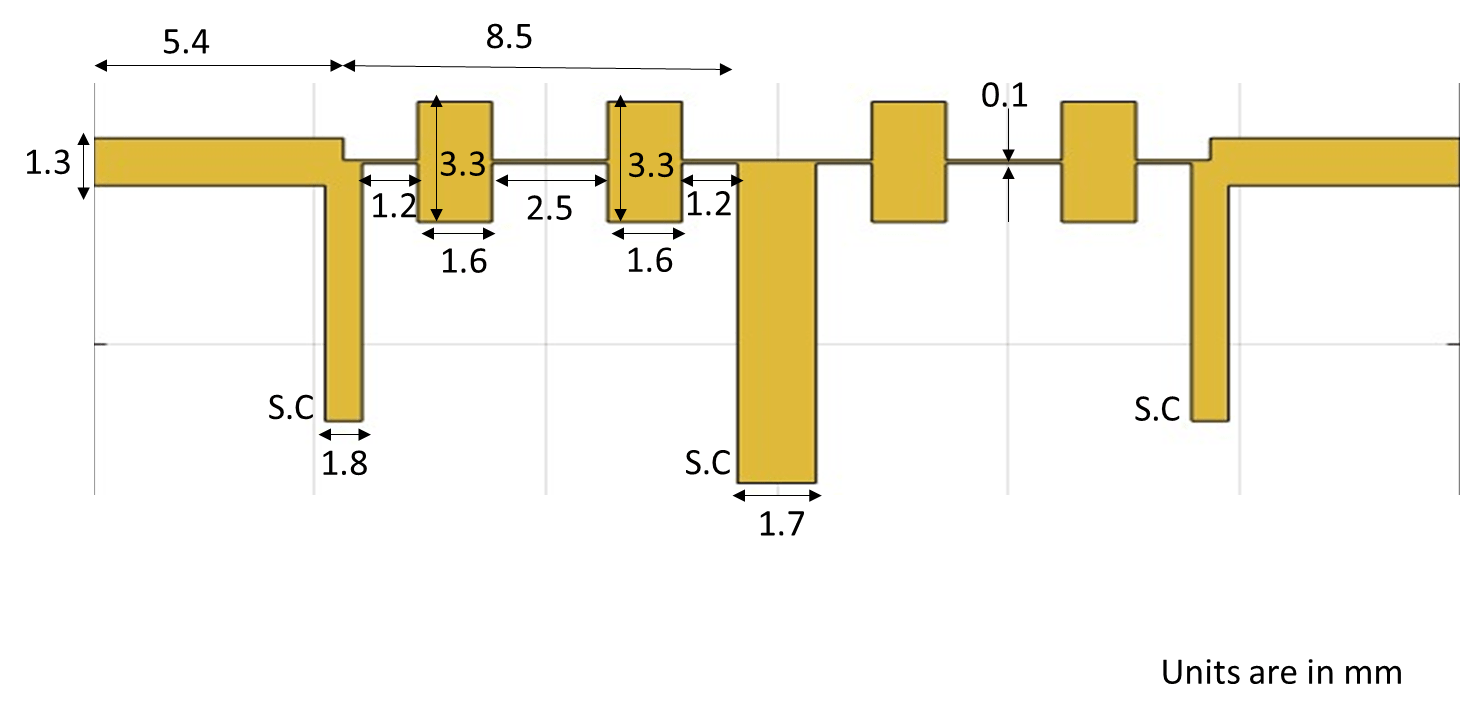
Schematic
Create filter
Use the filterStub object to create a stub filter. Define port lines and series line using the properties of PortLineLength, PortLineWidth, SeriesLineLength, and SeriesLineWidth. Define the stub length, stub width, and stub position using StubLength, StubWidth, and StubOffsetX. Set the StubShort and StubDirection according to the structure.
filter1 = filterStub;
filter1.PortLineLength = 5.4e-3;
filter1.PortLineWidth = 1.3e-3;
filter1.SeriesLineLength = 18.7e-3;
filter1.SeriesLineWidth = 0.1e-3;
filter1.StubLength = [7.1e-3 1.65e-3 1.65e-3 1.65e-3 1.65e-3 8.8e-3 1.65e-3 1.65e-3 1.65e-3 1.65e-3 7.1e-3];
filter1.StubWidth = [0.8e-3 1.6e-3 1.6e-3 1.6e-3 1.6e-3 1.7e-3 1.6e-3 1.6e-3 1.6e-3 1.6e-3 0.8e-3];
filter1.StubOffsetX = [-9.35e-3 -6.95e-3 -6.95e-3 -2.85e-3 -2.85e-3 0e-3 2.85e-3 2.85e-3 6.95e-3 6.95e-3 9.35e-3];
filter1.StubShort = [1 0 0 0 0 1 0 0 0 0 1];
filter1.StubDirection= [0 1 0 1 0 0 1 0 1 0 0];
filter1.GroundPlaneWidth= 0.0220;
filter1.Height = 0.508e-3;
substrate = dielectric("EpsilonR",3.05,"LossTangent",0.0001,"Thickness",0.508e-3);
filter1.Substrate = substrate;
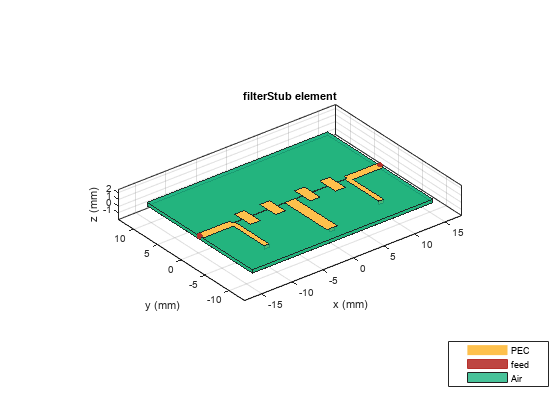
Visualize stub filter
Use the show function to visualize the filter.
figure;show(filter1)
Analyze filter
Use the mesh function and assign the MaxEdgeLength to 10 mm to ensure 25 triangles per wavelength.
figure;mesh(filter1,"MaxEdgeLength",0.010)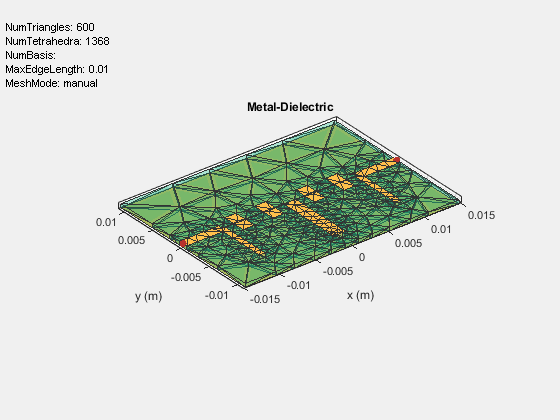
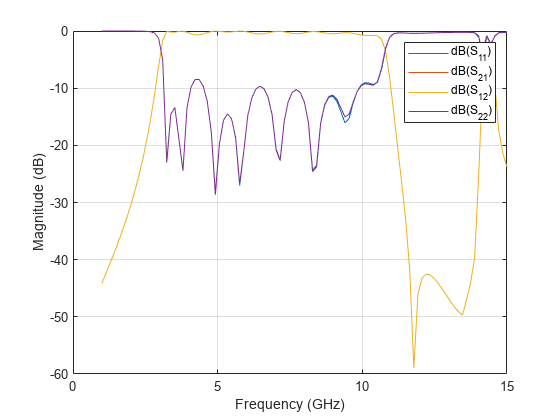
Use the sparameters function to calculate the S-Parameters and plot it using rfplot function.
s1=sparameters(filter1,linspace(1e9,15e9,101));
figure;rfplot(s1);
UWB 9-Pole Short Circuited Bandpass Filter
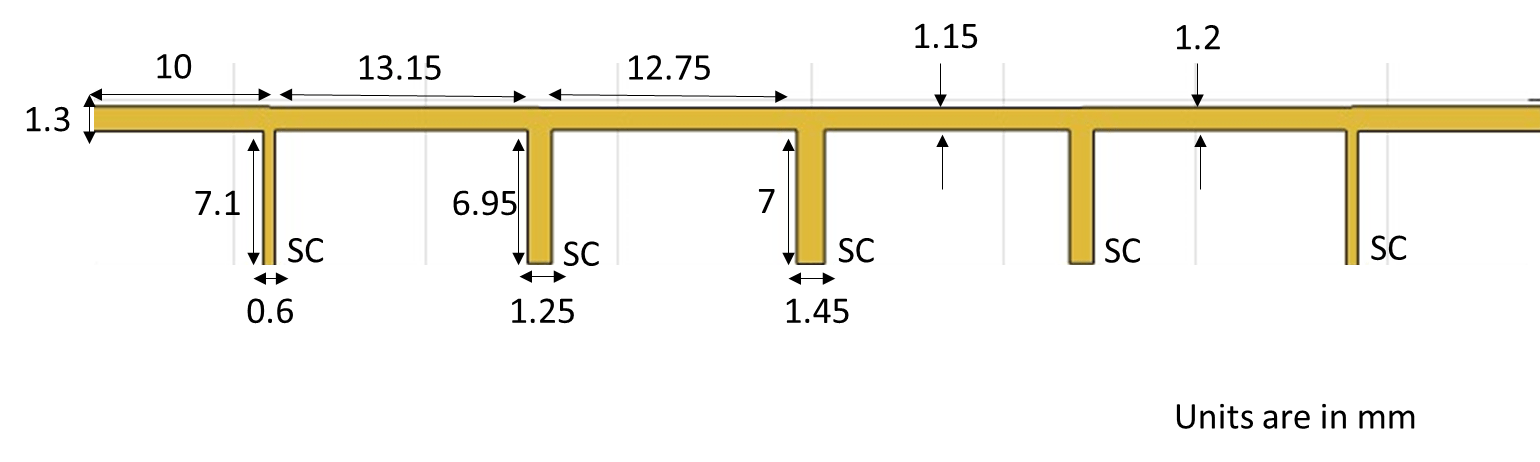
Schematic
Create filter
Use the filterStub object to create a stub filter. Define port lines and series line using the properties of PortLineLength, PortLineWidth, SeriesLineLength, and SeriesLineWidth. Define the stub length, stub width, and stub position using StubLength, StubWidth, and StubOffsetX. Set the StubShort and StubDirection according to the structure.
filter2 = filterStub;
filter2.PortLineLength = 0.01;
filter2.PortLineWidth = 1.3e-3;
filter2.SeriesLineLength = [14.075e-3 14.1e-3 14.1e-3 14.075e-3];
filter2.SeriesLineWidth = [1.2e-3 1.15e-3 1.15e-3 1.2e-3];
filter2.StubLength = [7.75e-3 7.55e-3 7.575e-3 7.55e-3 7.75e-3];
filter2.StubWidth = [0.6e-3 1.25e-3 1.45e-3 1.25e-3 0.6e-3];
filter2.StubOffsetX = [-28.175e-3 -14.1e-3 0 14.1e-3 28.175e-3];
filter2.StubShort = ones(1,5);
filter2.StubDirection= zeros(1,5);
filter2.GroundPlaneWidth= 0.0220;
filter2.Height = 0.508e-3;
substrate = dielectric("EpsilonR",3.05,"LossTangent",0.0001,"Thickness",0.508e-3);
filter2.Substrate = substrate;
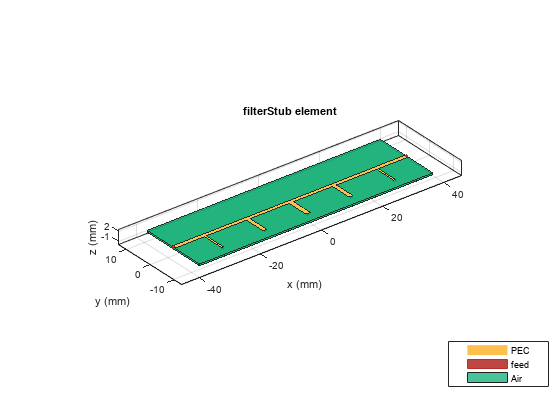
Visualize stub filter
figure;show(filter2)
Analyze the filter
Use the mesh function and assign the MaxEdgeLength to 10 mm ensure 25 triangles per wavelength.
figure;mesh(filter2,"MaxEdgeLength",0.02)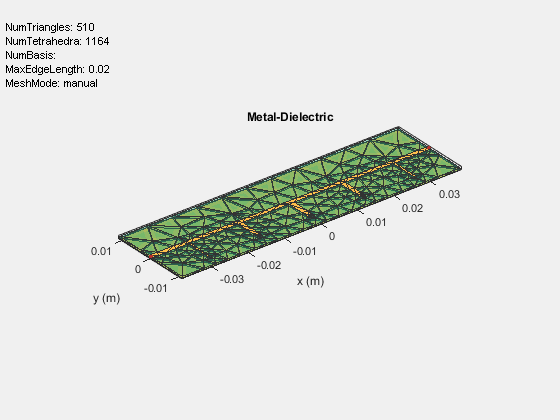
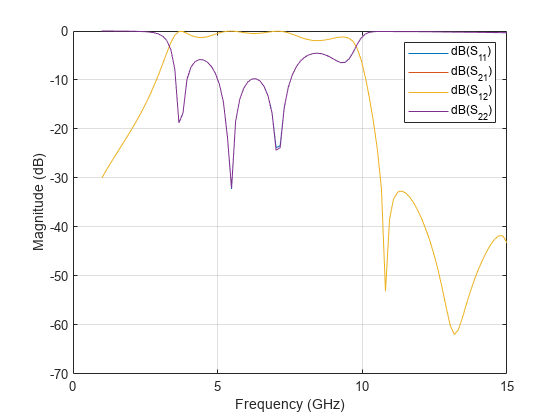
Use the sparameters function to calculate the S-Parameters and plot it using rfplot function.
s2=sparameters(filter2,linspace(1e9,15e9,101));
figure;rfplot(s2);